
SAMSHER SHAH
Data Analyst | Excel, Power BI, Tableau & SQL



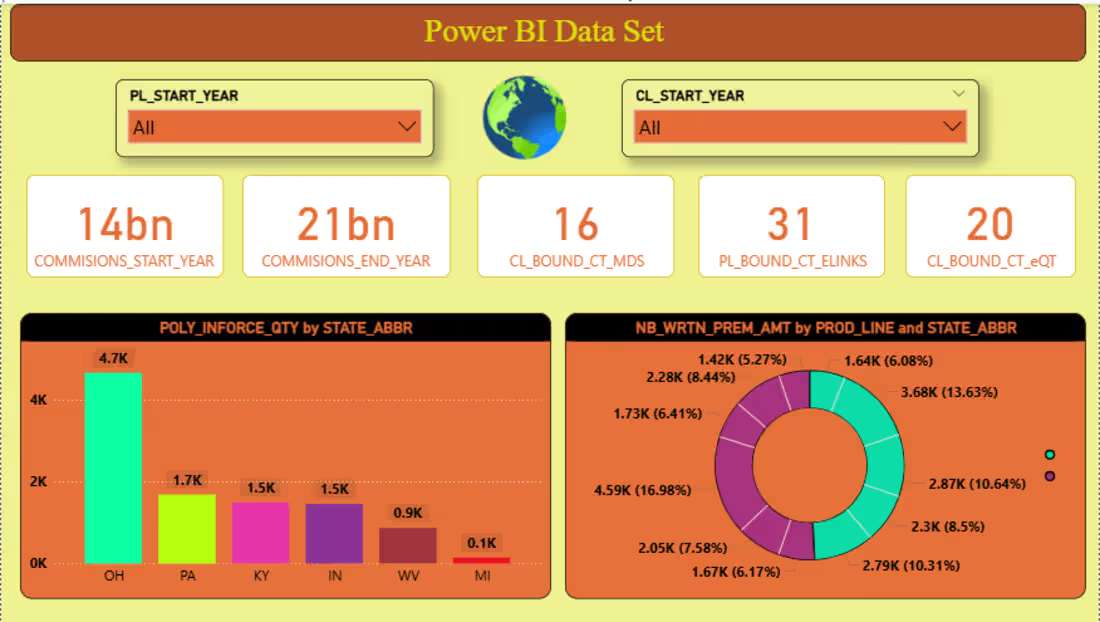
Power BI Project Description🩻
Sales Performance Dashboard | Power BI🙌
Developed an interactive Power BI dashboard to analyze sales performance, customer behavior, and business KPIs. The solution transforms raw data into actionable insights through dynamic visualizations and automated reporting.
Key Features:
Interactive KPI cards for Revenue, Inforce Policy Orders, and Growth
Sales analysis by State, Product Category, and Policy Segment
Dynamic slicers and drill-through functionality
Year-over-Year (YoY) performance tracking
Profitability and trend analysis using DAX measures
Data modeling with relationships and star schema design
Automated data refresh and optimized report performance
Tools & Technologies:
Power BI Desktop
Power Query
DAX
SQL / Excel Data Sources
Data Modeling & Visualization
Skills Tags🔥
Power BI • DAX • Power Query • Data Visualization • Business Intelligence • Dashboard Design • SQL • Data Analytics
1
42
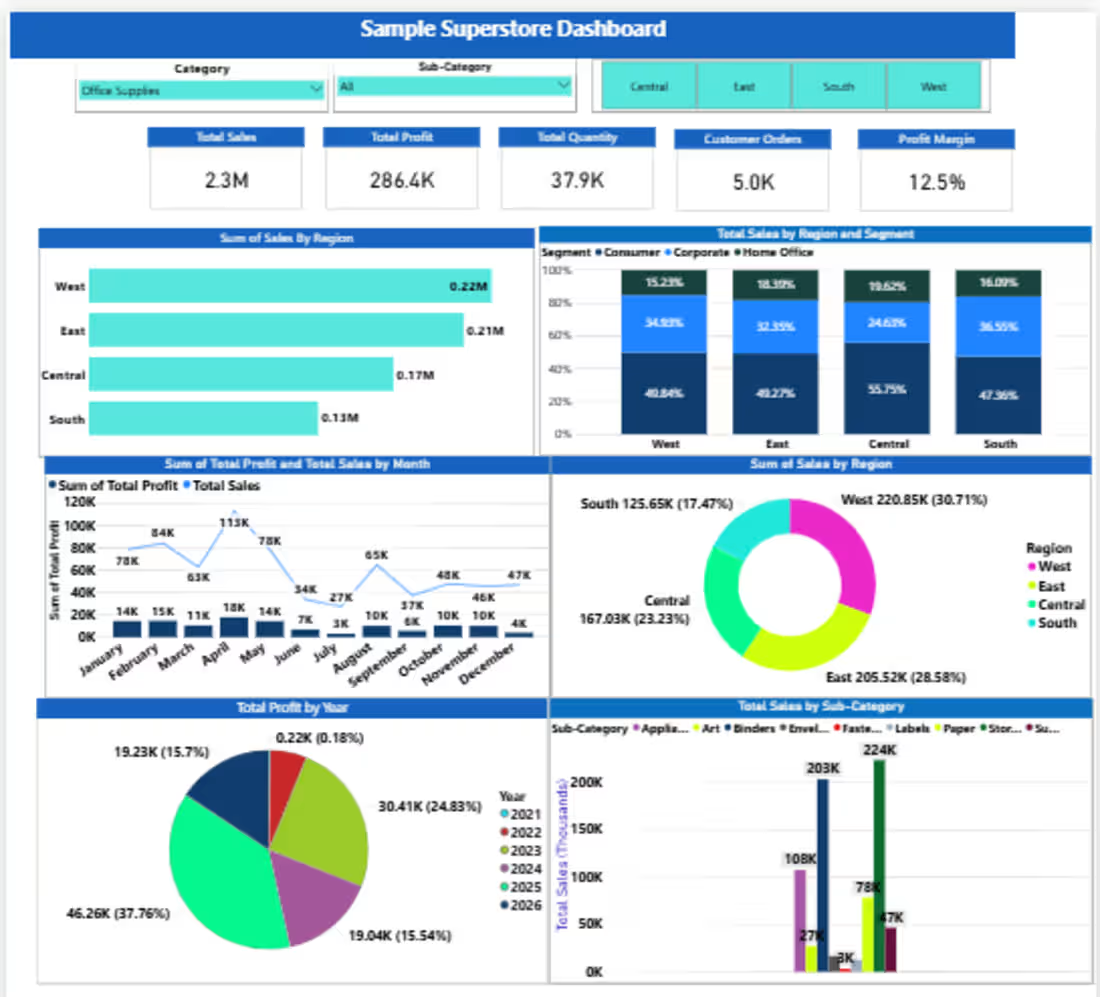
Hi Everyone🙌
Created Power BI Dashboard by Using the Many Tools and It is based on Sample super Store.
Using Tools
🚀 Dax Function
🎉 Data Modeling
🧠 Data Formatting
🚀 Data Visualizing
0
66
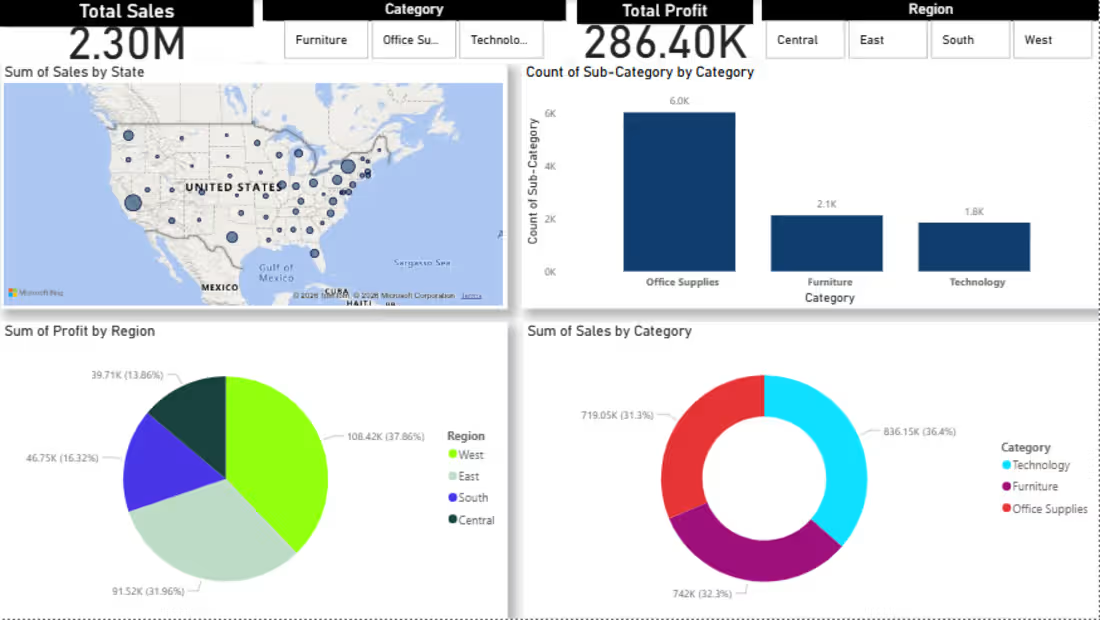
🚀 Import the Data from Excel File and Transformed in Power BI Desktop and Using Some Tools.
🔥 Data Cleaning and Data Formatting
🧠 Data Modeling and Using Dax Function
🚀 Data Filtering in Different Category
🎉 Created Attractive Dashboard
0
106
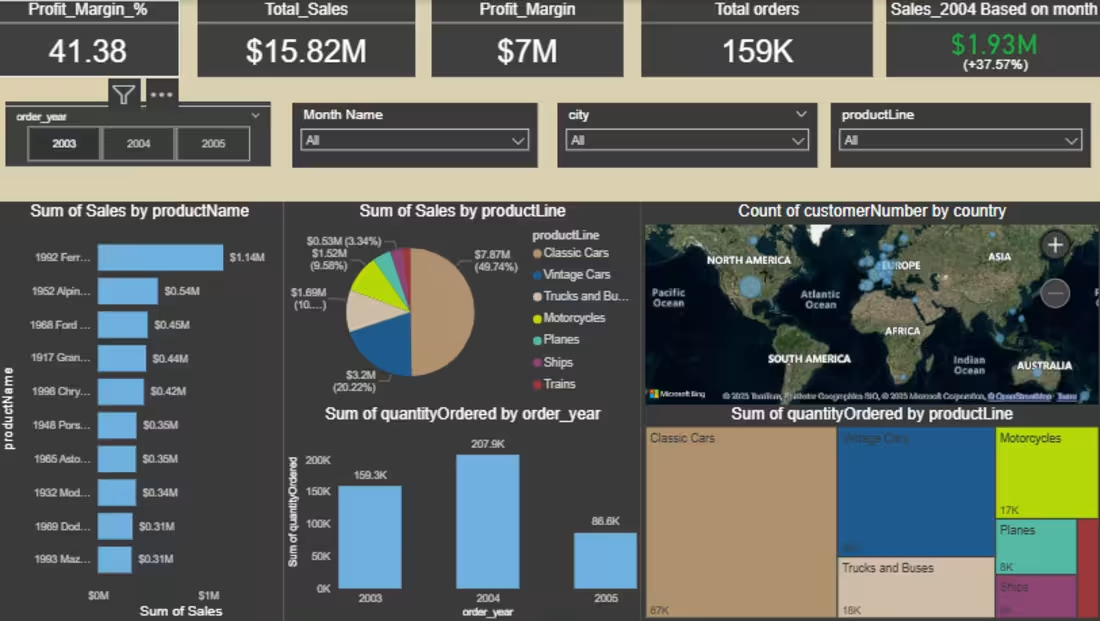
I Created Microsoft Power BI Dashboard By using many of the Tools
🚀 Data Modelling
🧠 Data Visualization
🚀 Group By
🧠 Data Cleaning
5
1.3K