
Sabbir Hossain
Data Analyst |Turning Data into Actionable Business Insights
New to Contra
Sabbir is building their profile!

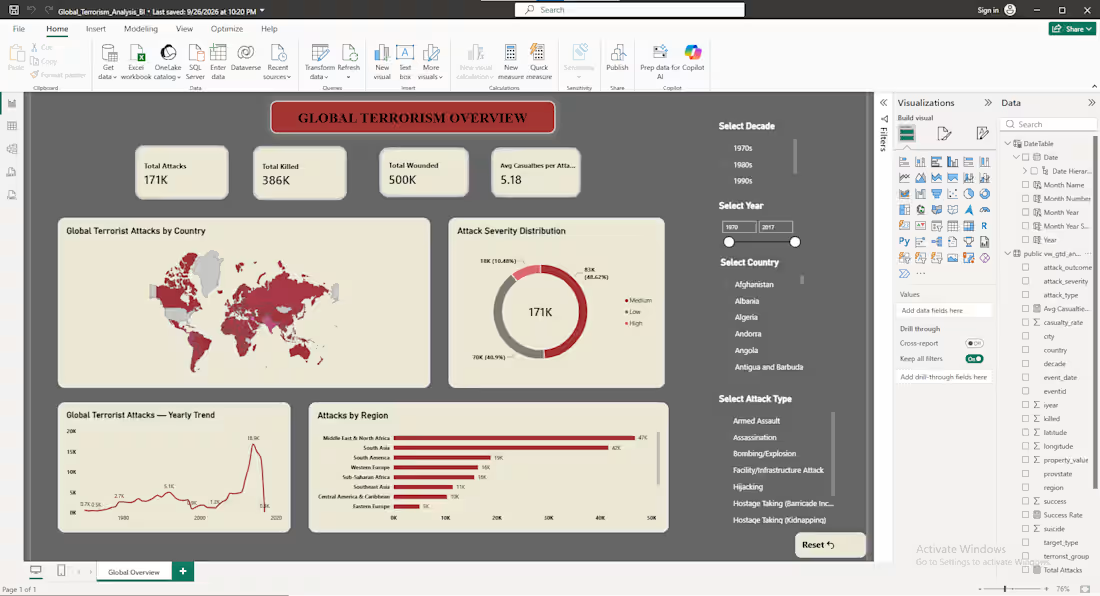
Global Terrorism Data Analysis & Power BI Dashboard
Project Description
An end-to-end data analytics project focused on analyzing global terrorism data to identify trends, patterns, and regional variations across countries and time periods.
What I did:
• Cleaned and explored the dataset using Python
• Performed data transformation and analysis using Python & SQL
• Stored and queried structured data using PostgreSQL
• Conducted analytical queries to identify trends and patterns
• Built an interactive Power BI dashboard
• Created KPI cards, maps, trend analysis, and comparative visualizations
• Added dynamic filters for decade, year, country, region, and attack type
Key Areas Analyzed:
🌍 Attacks by country and region
📅 Yearly and decade-wise trends
⚠️ Attack severity distribution
🎯 Attack type analysis
📊 Regional comparisons
🗺️ Geographic distribution of attacks
Tools:
Python • PostgreSQL • SQL • Power BI
Workflow:
Raw Data → Python → PostgreSQL → SQL Analysis → Power BI → Interactive Insights
Outcome:
The project demonstrates an end-to-end analytics workflow, transforming a large and complex dataset into an interactive dashboard that makes trends, geographic patterns, attack types, and severity levels easier to explore and understand.
0
27
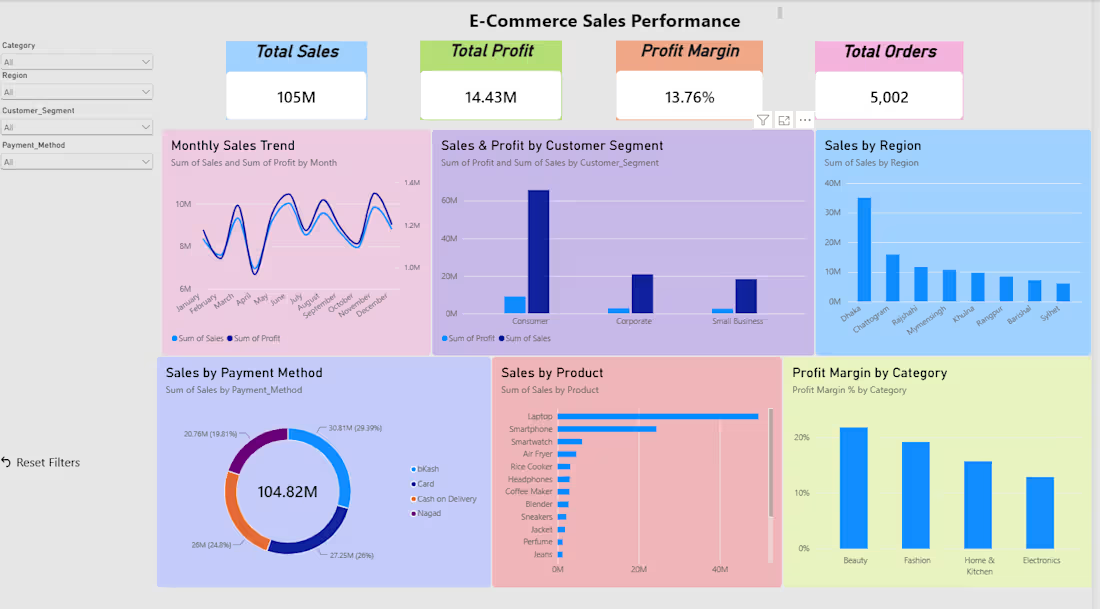
E-Commerce Sales & Profit Analysis | Power BI Dashboard
Project Description
An end-to-end e-commerce analytics project focused on understanding sales performance, profitability, customer behavior, and regional trends.
I analyzed 5,000+ orders to identify key business trends and performance drivers.
Key Areas Analyzed:
📈 Total Sales & Profit
📅 Monthly Sales Trends
👥 Customer Segment Performance
🌍 Regional Sales Analysis
📦 Product Performance
💰 Profit Margin by Category
💳 Payment Method Analysis
What I did:
• Cleaned and prepared the dataset using Excel
• Performed SQL-based analysis using PostgreSQL
• Built an interactive Power BI dashboard
• Created KPIs and visualizations to track business performance
• Analyzed sales, profit, customers, products, and regional performance
• Generated business insights from the analyzed data
Tools:
Excel • PostgreSQL • SQL • Power BI
Workflow:
Raw Data → Excel → PostgreSQL → SQL Analysis → Power BI → Business Insights
Outcome:
The dashboard provides a clear view of e-commerce performance and helps identify sales trends, profitable categories, customer segments, and areas for business improvement.
0
30
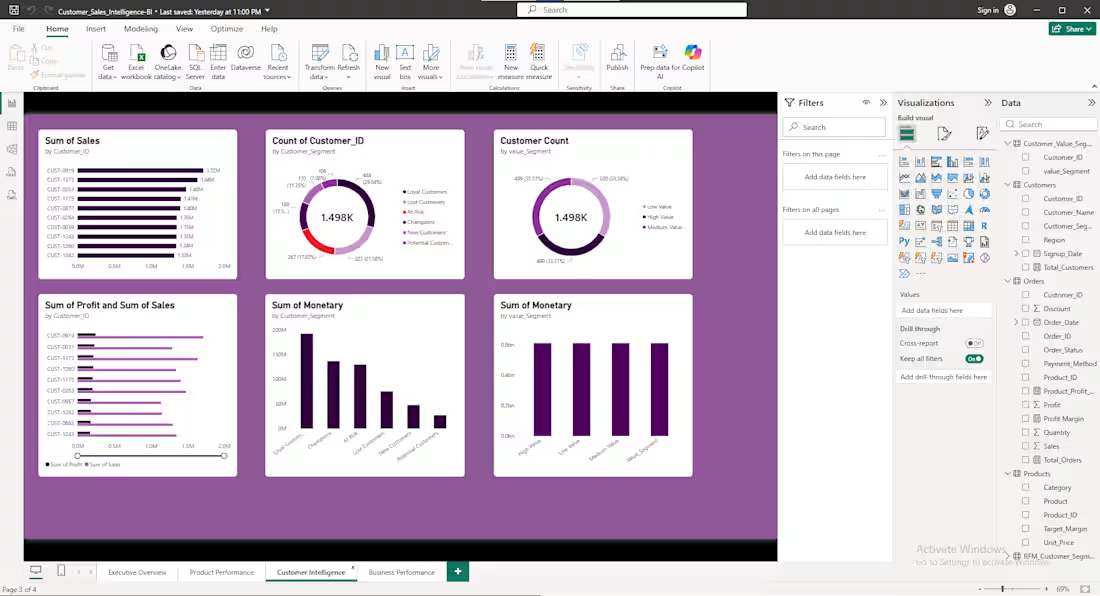
Customer Sales Intelligence & Profitability Analysis
Project Description
I analyzed 10,000 orders and 1,498 customers to identify the customers, products, and segments driving sales and profitability.
Key Insights:
📈 High-value customers contributed approximately 59.6% of total sales
⚠️ 267 At-Risk customers had previously generated approximately 129.82M in sales, highlighting a strong win-back opportunity
💰 High sales did not always mean high profitability
📊 Compared product-level sales, profit, and profit margins to identify more profitable opportunities
🎯 Used customer segmentation and RFM analysis to identify valuable and at-risk customers
What I delivered:
• Data cleaning and exploratory analysis using Python
• Data storage and analysis using PostgreSQL & SQL
• Customer segmentation and profitability analysis
• A 4-page interactive Power BI dashboard
• Business recommendations based on customer and product performance
Tools:
Python • PostgreSQL • SQL • Power BI • Excel
Workflow:
Raw Data → Python → PostgreSQL → SQL Analysis → Customer Segmentation → Power BI → Business Insights
Outcome:
The analysis transformed raw sales data into actionable insights for customer retention, win-back campaigns, product profitability, and revenue growth.
0
32
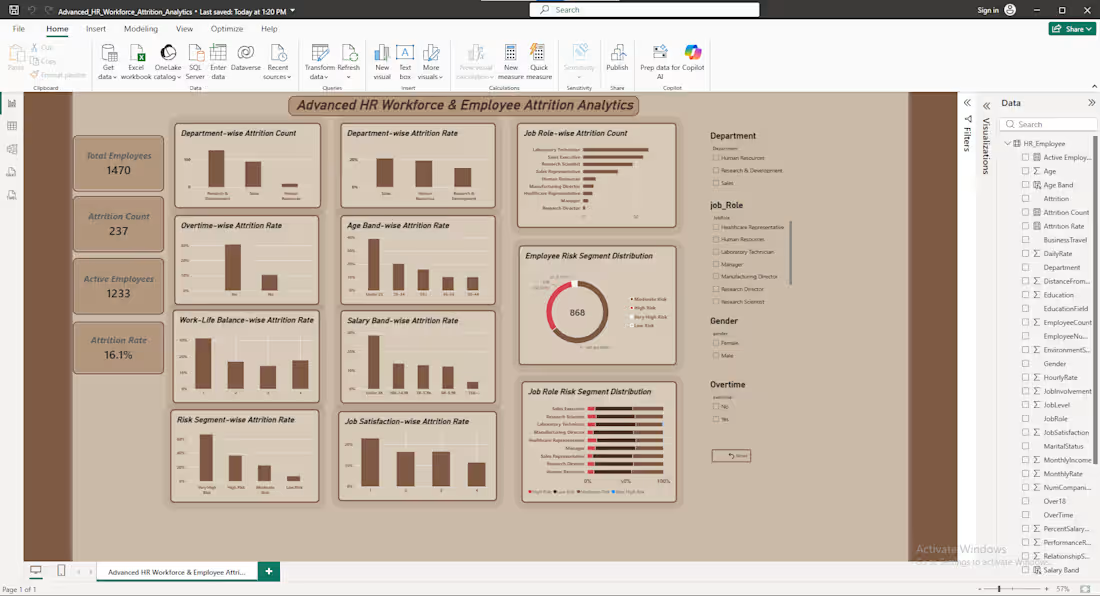
Advanced HR Workforce & Employee Attrition Analytics
An end-to-end HR analytics project focused on understanding employee attrition, workforce patterns, employee experience, and retention-related factors using a fictional HR dataset.
What I did:
Cleaned, explored, and transformed data using Python
Performed data quality checks and advanced analysis using PostgreSQL & SQL
Developed KPIs and attrition metrics using DAX
Built an interactive Power BI dashboard
Analyzed attrition by department, job role, overtime, salary, age, tenure, and promotion history
Created employee risk segmentation to identify higher-risk groups
Explored multi-factor relationships influencing employee attrition
Tools: Python • PostgreSQL • SQL • Power BI • DAX • Excel
Workflow:
Raw Data → Python → PostgreSQL → SQL Analysis → Power BI → Business Insights
Outcome:
The project demonstrates an end-to-end data analytics workflow and transforms raw HR data into actionable insights that can support workforce and retention decisions.
0
62