The network for creativity
Join 1.25M professional creatives like you
Connect with clients, get discovered, and run your business 100% commission-free
Creatives on Contra have earned over $150M and we are just getting started
Back to feedPost

Global Terrorism Data Analysis & Power BI Dashboard
Project Description
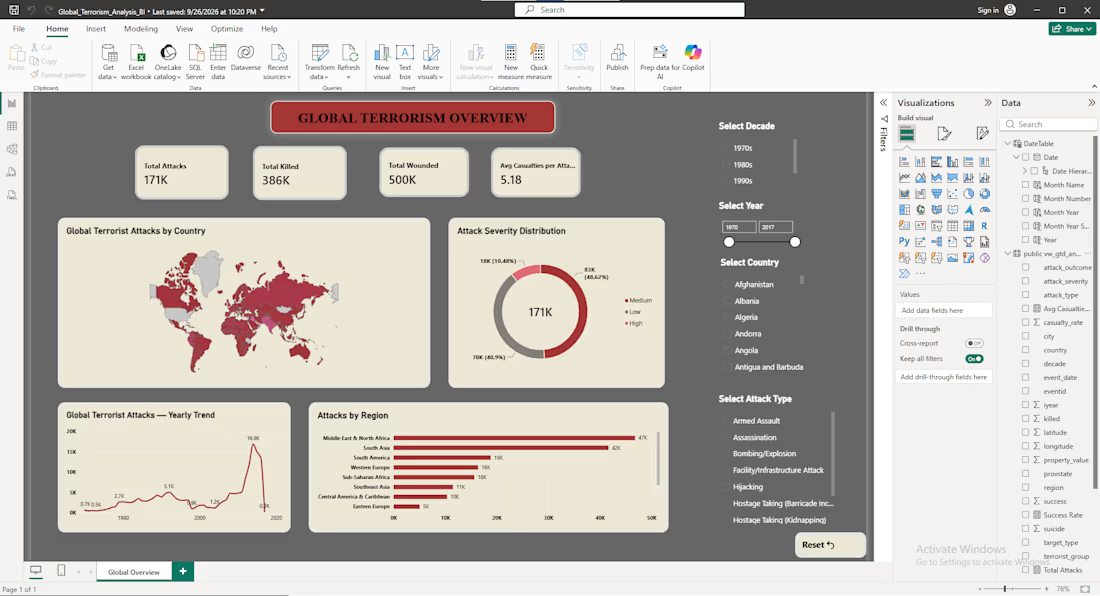
An end-to-end data analytics project focused on analyzing global terrorism data to identify trends, patterns, and regional variations across countries and time periods.
What I did:
• Cleaned and explored the dataset using Python
• Performed data transformation and analysis using Python & SQL
• Stored and queried structured data using PostgreSQL
• Conducted analytical queries to identify trends and patterns
• Built an interactive Power BI dashboard
• Created KPI cards, maps, trend analysis, and comparative visualizations
• Added dynamic filters for decade, year, country, region, and attack type
Key Areas Analyzed:
🌍 Attacks by country and region
📅 Yearly and decade-wise trends
⚠️ Attack severity distribution
🎯 Attack type analysis
📊 Regional comparisons
🗺️ Geographic distribution of attacks
Tools:
Python • PostgreSQL • SQL • Power BI
Workflow:
Raw Data → Python → PostgreSQL → SQL Analysis → Power BI → Interactive Insights
Outcome:
The project demonstrates an end-to-end analytics workflow, transforming a large and complex dataset into an interactive dashboard that makes trends, geographic patterns, attack types, and severity levels easier to explore and understand.


The network for creativity
Join 1.25M professional creatives like you
Connect with clients, get discovered, and run your business 100% commission-free
Creatives on Contra have earned over $150M and we are just getting started





Related posts

"We can't afford a data analyst."
I've heard this from 3 different startups this year.
So I built one.
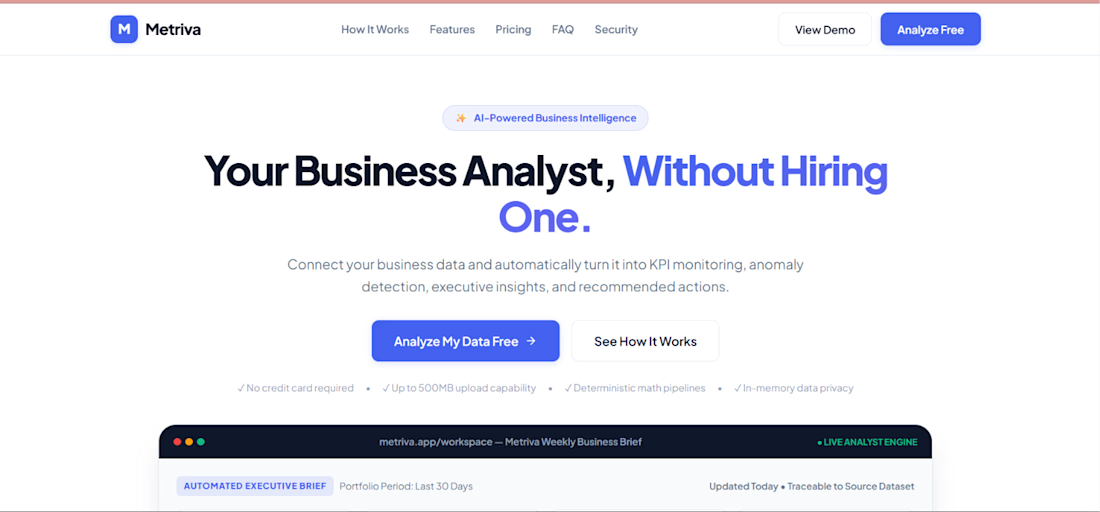
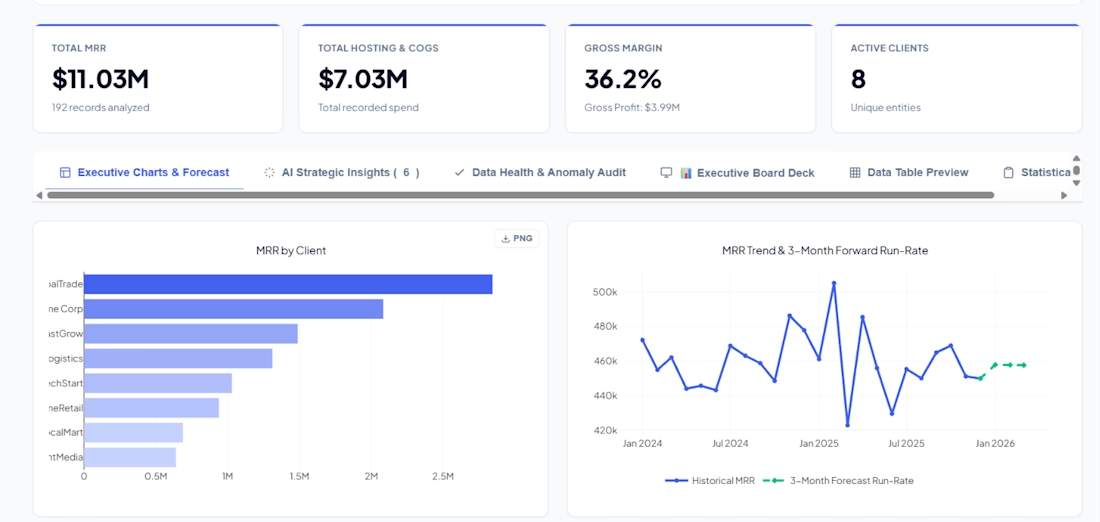
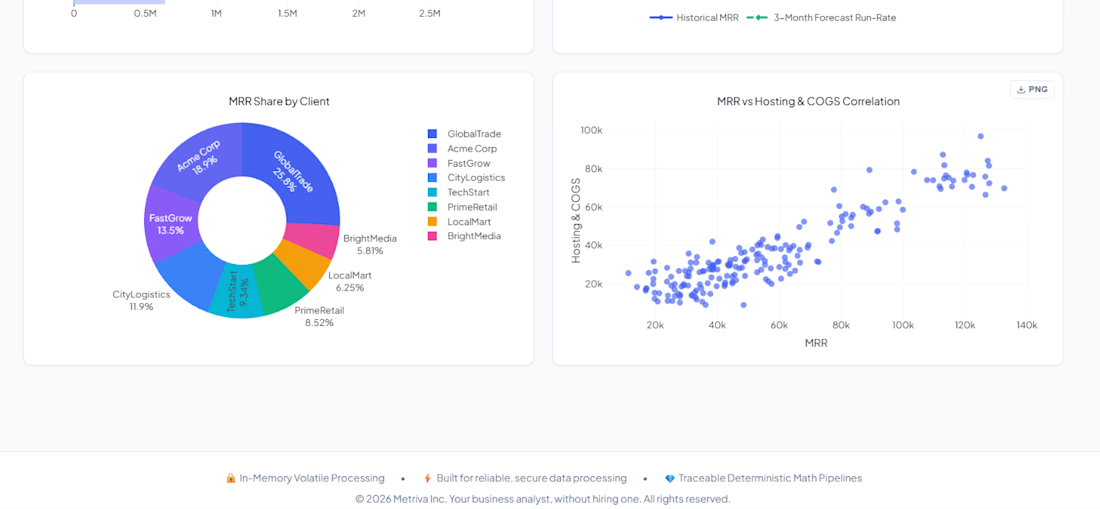
Metriva is an AI-powered business analyst that:
📊 Turns messy spreadsheets into executive dashboards
🧠 Writes C-level business briefs automatically
📈 Forecasts trends + detects anomalies
💬 Answers questions about your data in plain English
🎯 Finds your Pareto 80/20 — who drives 80% of your revenue?
No SQL. No Python. No data team.
Just upload your file and get answers.
Built with Flask, vanilla JS, and a lot of late nights.
🔗 Try it: metriva.ai1.vercel.app
#AI #BusinessIntelligence #Founder #IndieHacker #DataScience

The brief-writing piece is interesting — curious how you handle the validation step. AI-generated language tends to sound confident even when the underlying data is sparse or the trend is ambiguous. One pattern that helps: have the model output a confidence signal alongside the...

Full-Stack Developer & AI Automation Engineer
I build scalable web applications, SaaS platforms, mobile apps, custom dashboards, and AI-powered automation systems that turn complex business workflows into reliable digital products.
My core stack includes Next.js, React, Node.js, NestJS, Python, PostgreSQL, MongoDB, and AI APIs.
I specialize in turning ideas into production-ready systems—from architecture and development to deployment, automation, and optimization.
Available for:
AI Automation • SaaS Development • Web Development • Mobile Apps • Custom Dashboards • API Development • Business Automation


Seeing how you stitch AI APIs into custom dashboards really cuts the manual data wrangling. The stack choice keeps the deployment pipeline smooth.

AI Property Maintenance Automation
AI-powered property maintenance automation designed to streamline how property management teams handle tenant maintenance requests.
The system takes a maintenance request, analyzes the issue, determines its priority and category, recommends a suitable vendor, and automatically creates a structured work order.
Workflow:
Tenant request → AI analysis → Priority & category → Vendor matching → Work order
Built with: Python, Flask, SQLite, HTML, CSS, JavaScript, and AI-assisted request classification.
This project was built as a portfolio demonstration of AI automation for property management operations.


Turning a tenant request into a ready work order in seconds removes the manual triage step.