
PL-300 Microsoft Certified Power BI Data AnalystSidra choudry
I take a practical, business-focused approach to data and reporting, with a strong emphasis on clarity and accessibility. I spent eight months working closely with my mentor, Juliana Smith, focusing specifically on building accessible, data-driven Power BI reports that are easy to understand and usable by a wide range of audiences.
Through this experience, I became highly precise in designing reports that follow accessibility best practices while still delivering meaningful insights. My goal is to create dashboards that are not only visually clean but also accurate, inclusive, and genuinely useful for everyday decision-making.
I work closely with clients to understand their needs, clean and model their data properly, and replace manual reporting with reliable Power BI solutions. Clear communication, attention to detail, and on-time delivery are important to me, and I keep clients informed throughout the project.
If you’re unsure which metrics matter most, I can help define the right KPIs and reporting structure based on your business goals.
What's included
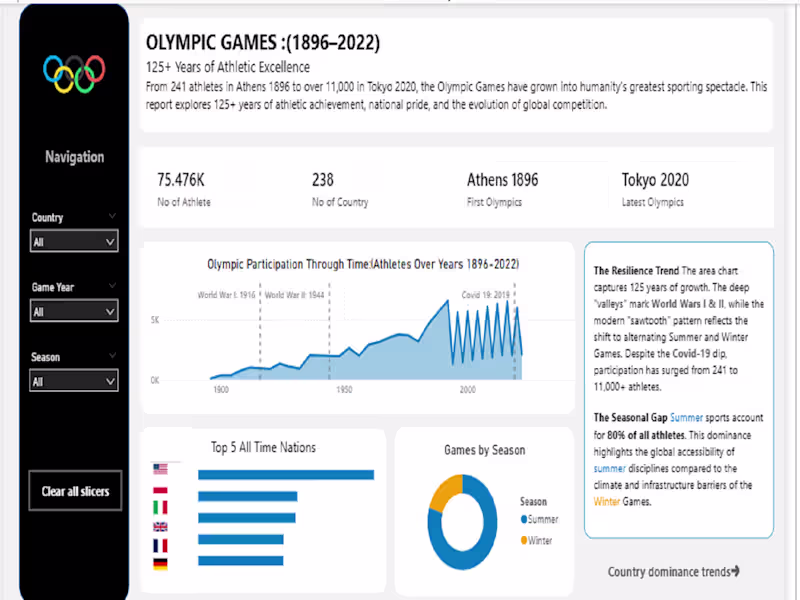
Interactive Power BI Dashboard
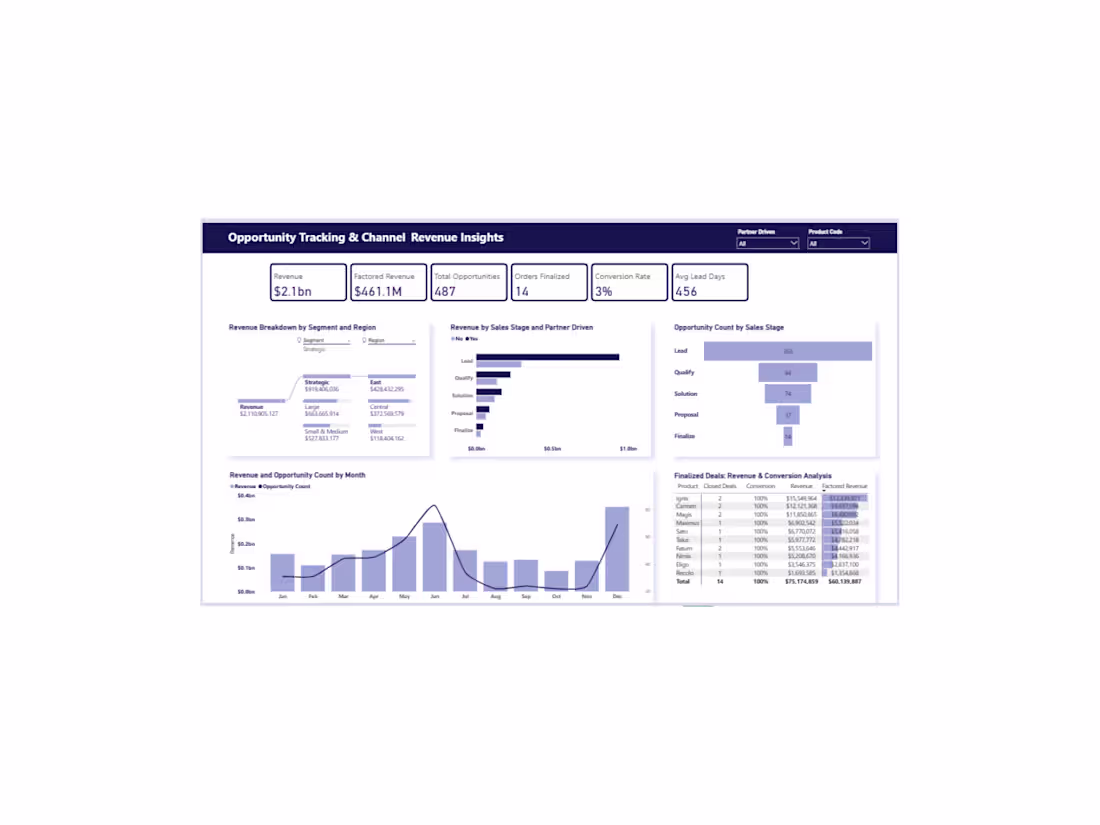
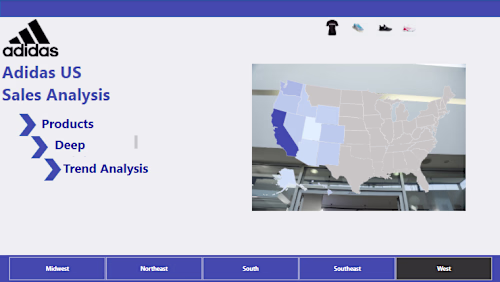
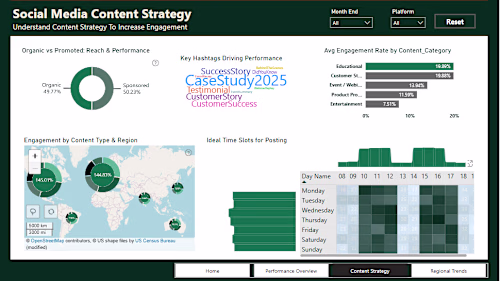
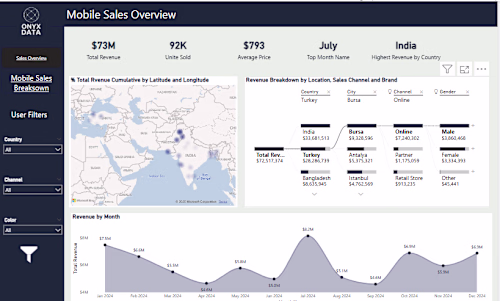
A clean, professional Power BI dashboard tailored to your business goals, with filters, KPIs, and clear visuals for decision-making.
Data Cleaning & Modeling
Cleaned, structured, and well-modeled data using Power Query and relationships to ensure accurate and fast reporting.
Automated Reporting Setup
Automated refresh and report setup to reduce manual Excel work and save time.
Insights Summary & Walkthrough
A short written or video walkthrough explaining insights, metrics, and how to use the dashboard effectively.
FAQs
Example work
Sidra's other services

Starting at$50
Duration7 days
Tags
Microsoft Excel
Microsoft Power BI
SQL
Business Analyst
Data Analyst
Data Visualizer
Service provided by
Sidra choudry High Point, USA
- 23
- Followers
PL-300 Microsoft Certified Power BI Data AnalystSidra choudry
Starting at$50
Duration7 days
Tags
Microsoft Excel
Microsoft Power BI
SQL
Business Analyst
Data Analyst
Data Visualizer
I take a practical, business-focused approach to data and reporting, with a strong emphasis on clarity and accessibility. I spent eight months working closely with my mentor, Juliana Smith, focusing specifically on building accessible, data-driven Power BI reports that are easy to understand and usable by a wide range of audiences.
Through this experience, I became highly precise in designing reports that follow accessibility best practices while still delivering meaningful insights. My goal is to create dashboards that are not only visually clean but also accurate, inclusive, and genuinely useful for everyday decision-making.
I work closely with clients to understand their needs, clean and model their data properly, and replace manual reporting with reliable Power BI solutions. Clear communication, attention to detail, and on-time delivery are important to me, and I keep clients informed throughout the project.
If you’re unsure which metrics matter most, I can help define the right KPIs and reporting structure based on your business goals.
What's included
Interactive Power BI Dashboard
A clean, professional Power BI dashboard tailored to your business goals, with filters, KPIs, and clear visuals for decision-making.
Data Cleaning & Modeling
Cleaned, structured, and well-modeled data using Power Query and relationships to ensure accurate and fast reporting.
Automated Reporting Setup
Automated refresh and report setup to reduce manual Excel work and save time.
Insights Summary & Walkthrough
A short written or video walkthrough explaining insights, metrics, and how to use the dashboard effectively.
FAQs
Example work
Sidra's other services
$50