
Power BI DeveloperSidra choudry

I transform complex datasets into visually compelling, decision-ready reports. By combining technical skills with a deep understanding of business needs, I create analytics solutions that uncover opportunities and improve performance.
What's included
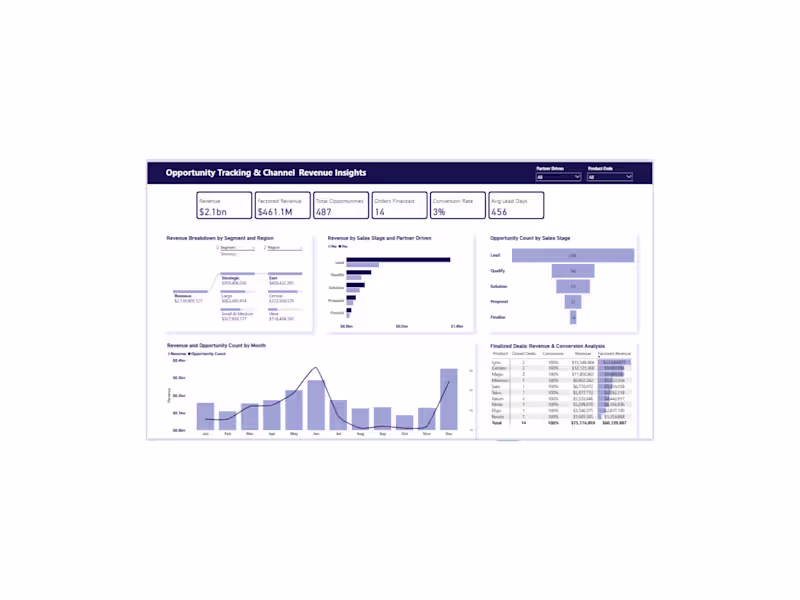
Interactive Power BI Dashboard
A fully interactive Power BI dashboard tailored to your business needs, including visualizations, KPIs, and filters for easy data exploration. Delivered as a .pbix file and online view link.
Data Insights & Recommendations Report
A PowerPoint presentation summarizing key findings from the dashboard, highlighting trends, anomalies, and actionable recommendations for decision-making.
Dashboard Walkthrough Video
A short video walkthrough explaining how to navigate the dashboard, use filters, and interpret visualizations for maximum value.
Cleaned & Structured Dataset
Cleaned, transformed, and structured data in Excel/CSV format, ready for analysis and reporting. Includes removal of duplicates, formatting consistency, and data validation.
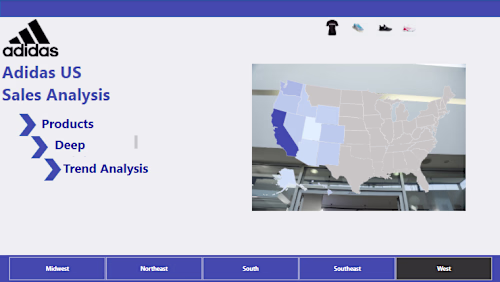
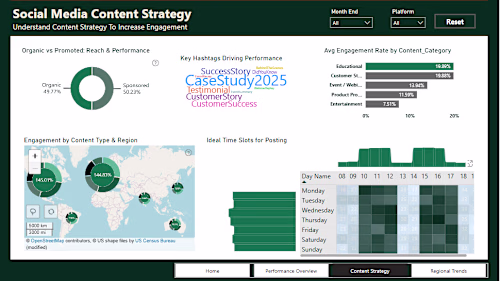
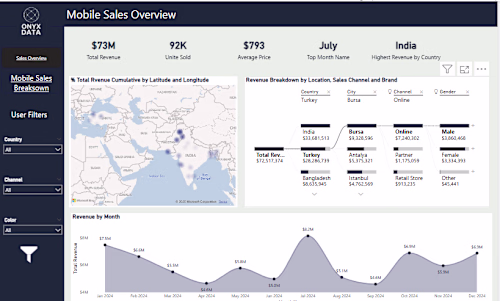
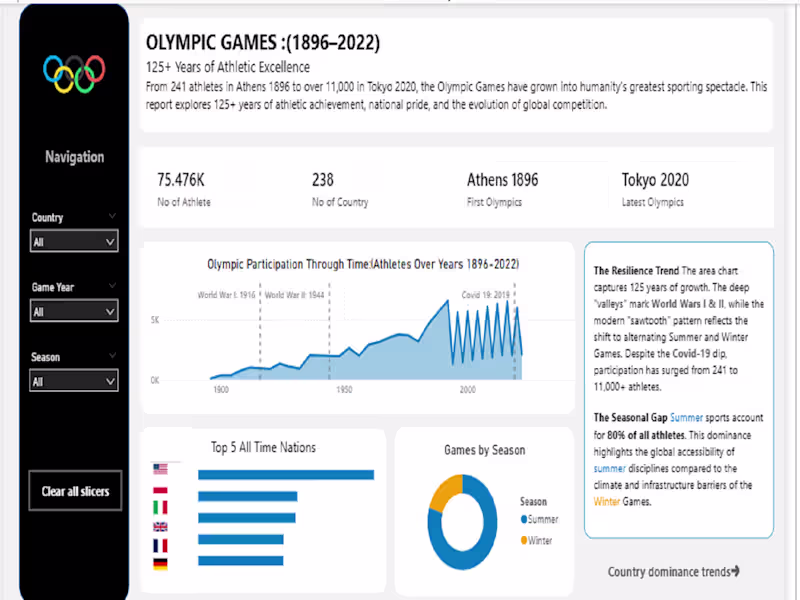
Example work
Sidra's other services
Starting at$80
Duration1 week
Tags
Microsoft Excel
Microsoft Power BI
Data Analyst
Data Modelling Analyst
Data Visualizer
Service provided by
Sidra choudry High Point, USA
- 23
- Followers
Power BI DeveloperSidra choudry
Starting at$80
Duration1 week
Tags
Microsoft Excel
Microsoft Power BI
Data Analyst
Data Modelling Analyst
Data Visualizer
I transform complex datasets into visually compelling, decision-ready reports. By combining technical skills with a deep understanding of business needs, I create analytics solutions that uncover opportunities and improve performance.
What's included
Interactive Power BI Dashboard
A fully interactive Power BI dashboard tailored to your business needs, including visualizations, KPIs, and filters for easy data exploration. Delivered as a .pbix file and online view link.
Data Insights & Recommendations Report
A PowerPoint presentation summarizing key findings from the dashboard, highlighting trends, anomalies, and actionable recommendations for decision-making.
Dashboard Walkthrough Video
A short video walkthrough explaining how to navigate the dashboard, use filters, and interpret visualizations for maximum value.
Cleaned & Structured Dataset
Cleaned, transformed, and structured data in Excel/CSV format, ready for analysis and reporting. Includes removal of duplicates, formatting consistency, and data validation.
Example work
Sidra's other services
$80