Home Service Job Scheduling & Payment Dashboard

Ivy

Home Service Job Scheduling & Payment Dashboard
Project overview
Built a demo dashboard for a home-service business to track jobs from inquiry to payment. The demo workbook contains 20 fictional jobs and shows a live status summary, totals, and overdue flags. No real client data is used.
What it does
Status summary: counts of completed, in-progress, scheduled, and cancelled jobs.
Money summary: total billed, total paid, and outstanding balance.
Overdue flag: jobs scheduled in the past that are still open.
Tabs: dashboard, inquiries, payments, and a 20-row job fixture.
How it was built
Demo data in a structured job table with status and payment fields.
Dashboard formulas calculate counts and money totals from the job table.
Conditional logic marks overdue jobs based on scheduled date and status.
Section 7 — Screenshots / visual evidence
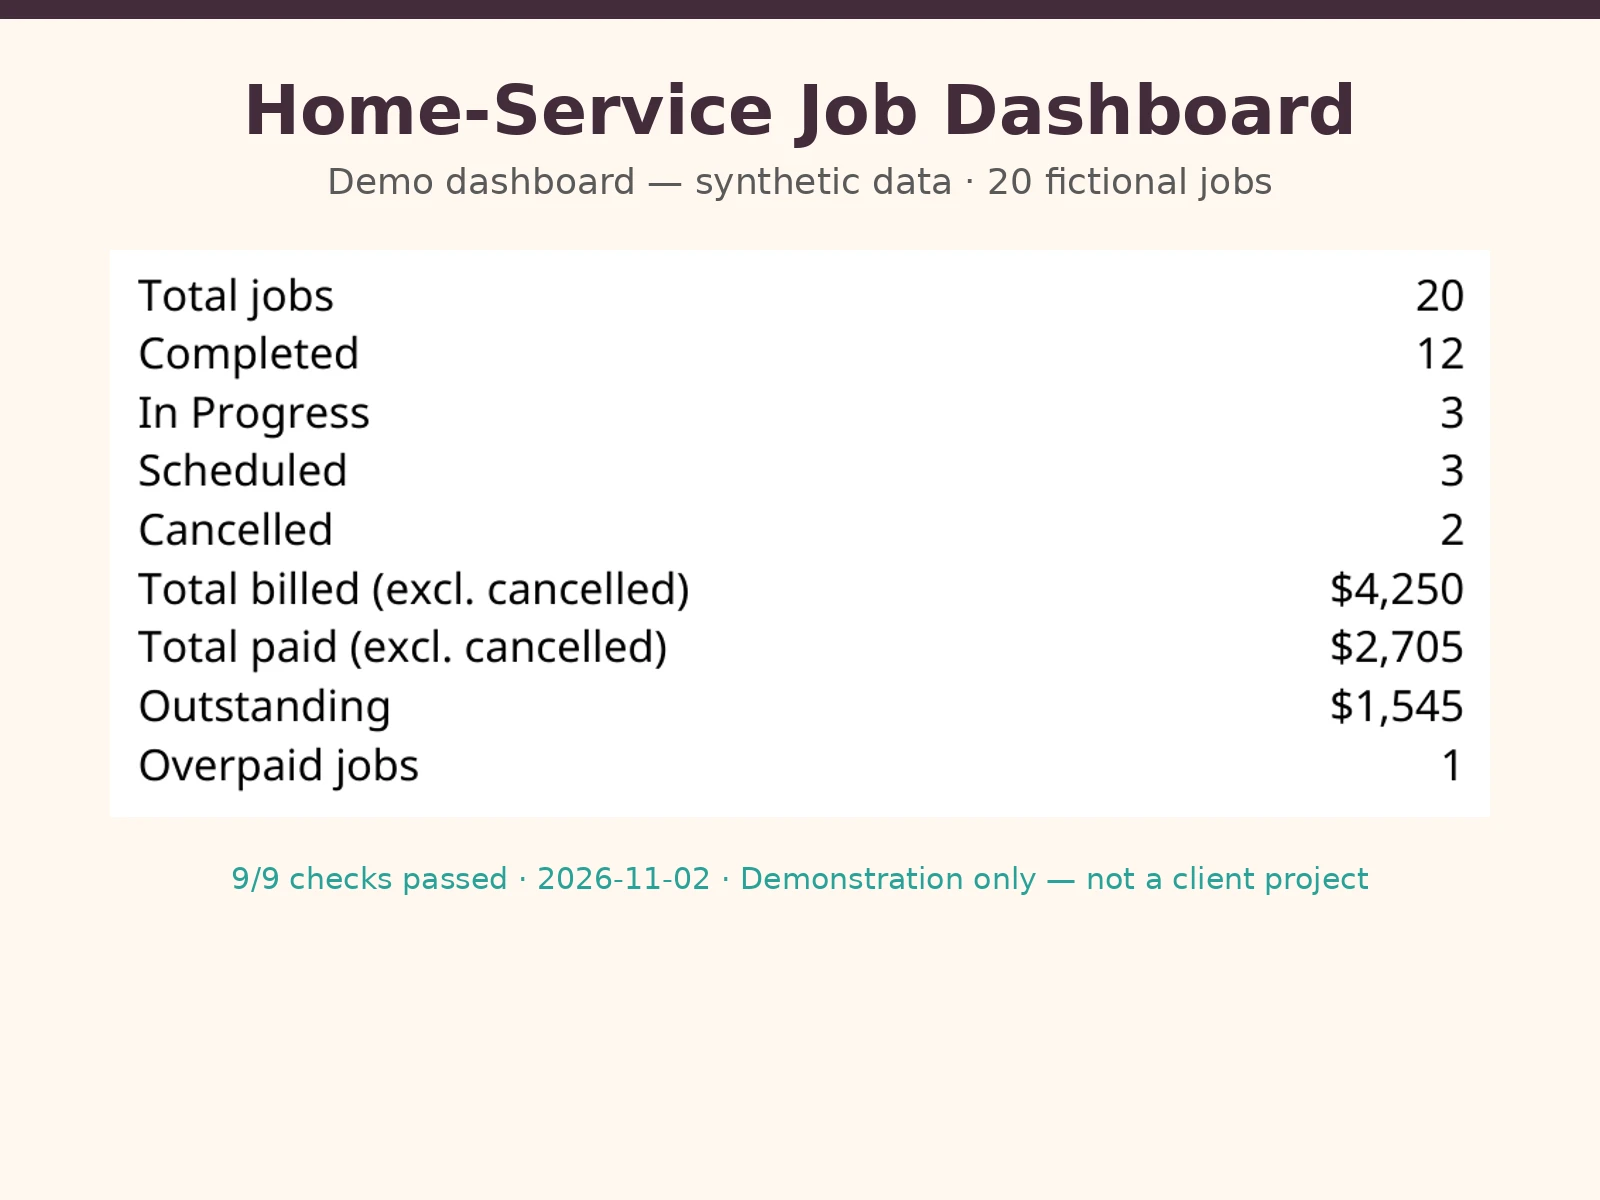
Dashboard view: shown as the featured image above. Inquiries tab and payments tab: to be captured from the live demo.
Section 8 — QA results
9 checks · 9 passed · 0 failed · 2026-11-02
Total jobs 20 (fixture has 20 rows).
Completed 12, in-progress 3, scheduled 3, cancelled 2.
Total billed $4,250.
Total paid $2,705.
Outstanding $1,545.
Overdue jobs 1.
Total billed = total paid + outstanding ($4,250 = $2,705 + $1,545).
Paid + outstanding + cancelled value: $2,705 + $1,545 + $550 = $4,800.
Dashboard totals match job-table totals.
Disclosure
Demonstration only — no real client data. Built as a portfolio demo to show dashboard design and QA method. Numbers come from a 20-row synthetic fixture and are reproducible from it.
Like this project
Posted Nov 6, 2026
Demo dashboard for a home-service business: 20 jobs tracked, $4,250 billed, 9/9 QA checks passed. Synthetic data — not a client project.
Likes
0
Views
0