
Overview
An independent sample showing how I turn monthly financial data into a readable Excel report. The 2025 operating data is synthetic; no client or investment results are shown.
Objective
Present revenue against budget, operating profit and operating margin clearly, with every dashboard figure traceable to the data sheet.
My role
I defined the report structure and the metric definitions, built the workbook with AI-assisted tooling, and reviewed and tested the calculations.
Approach
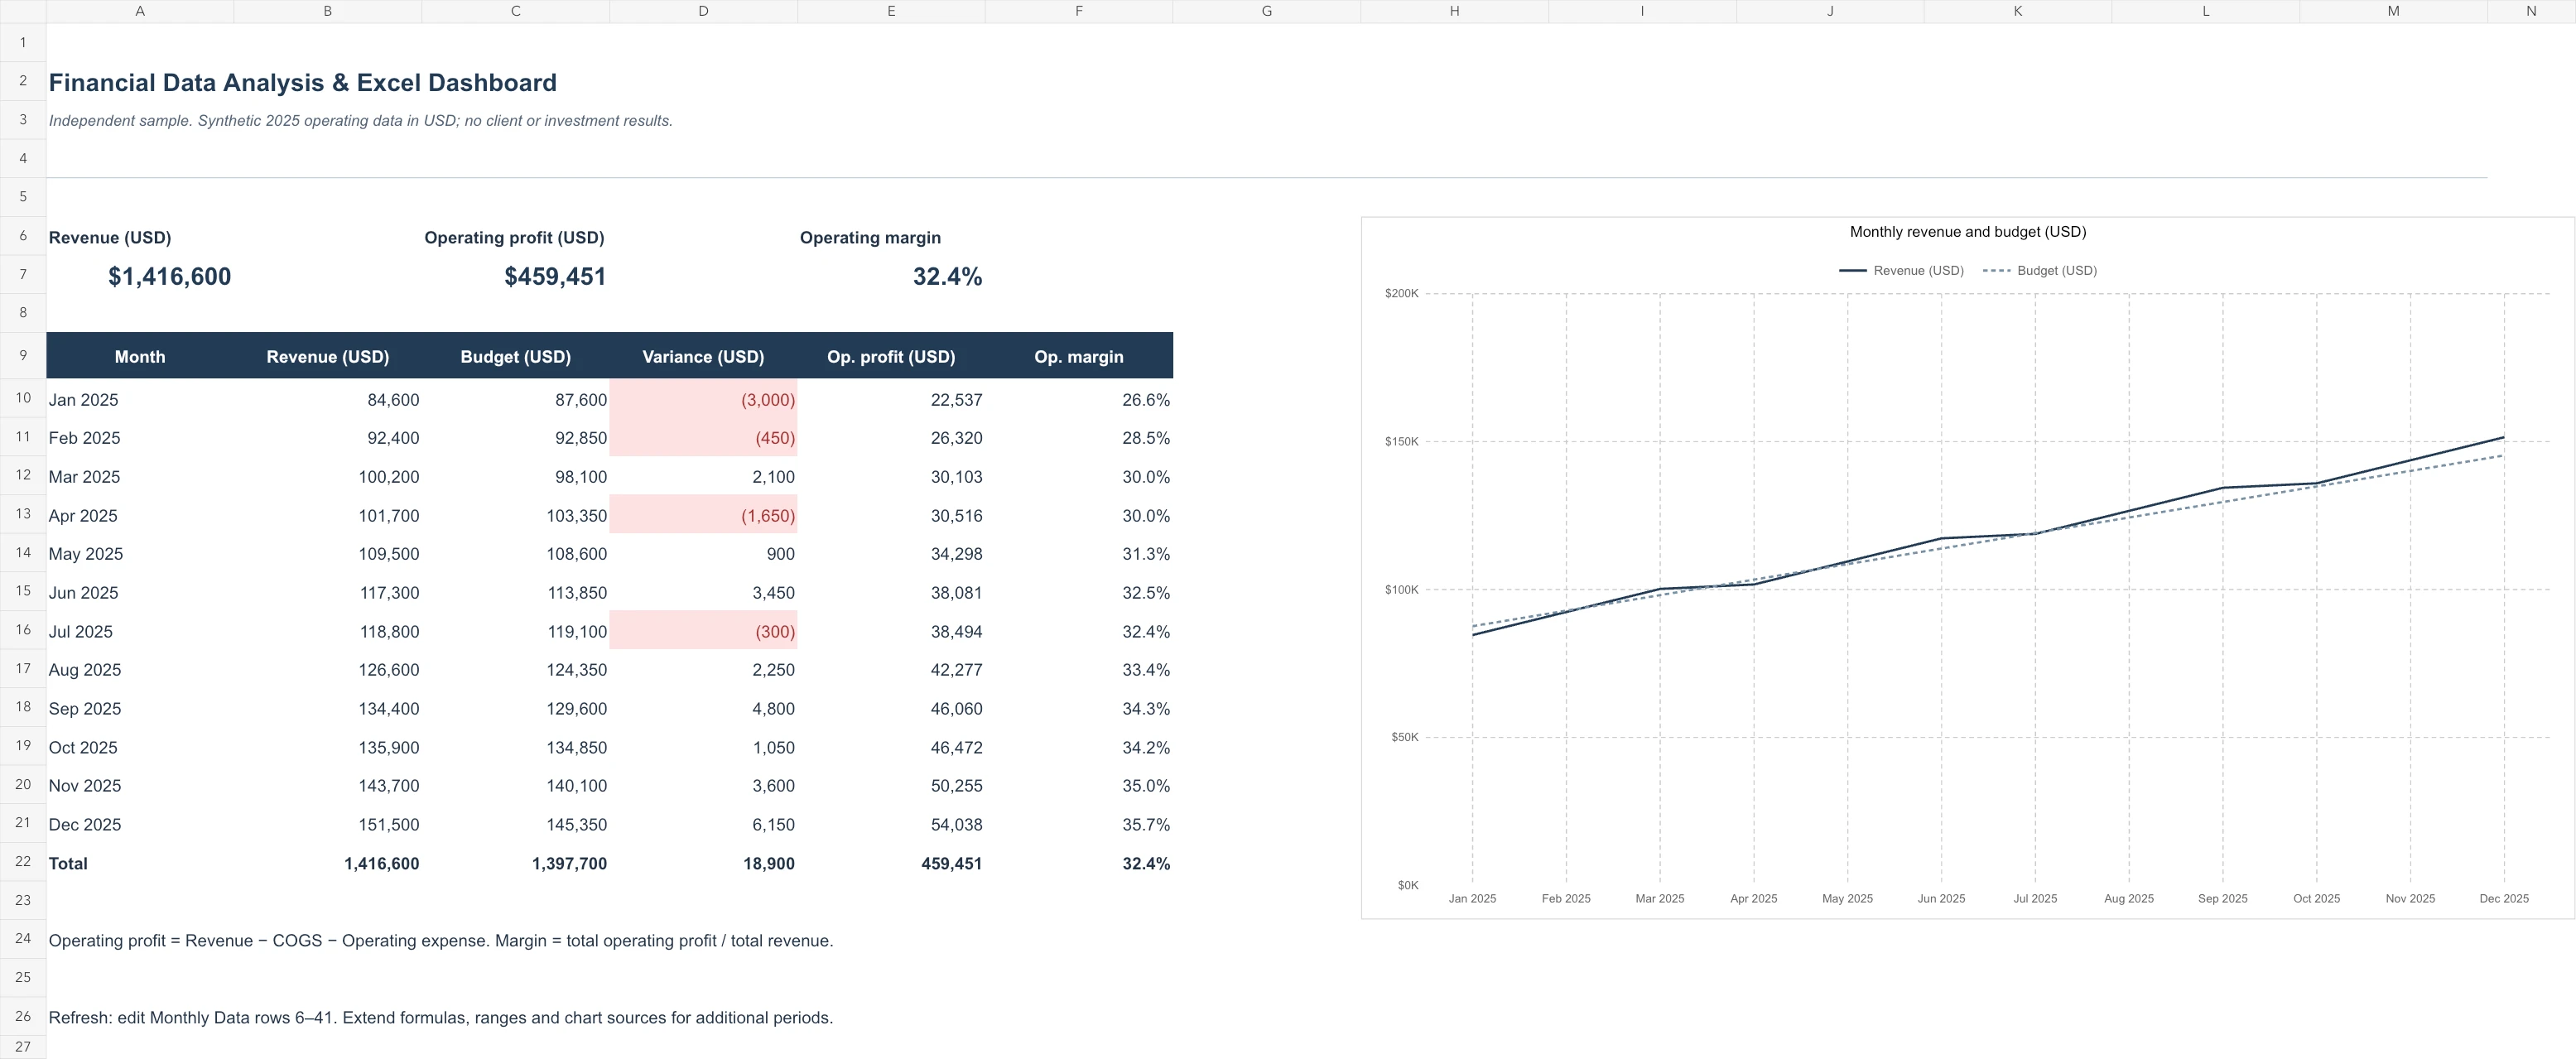
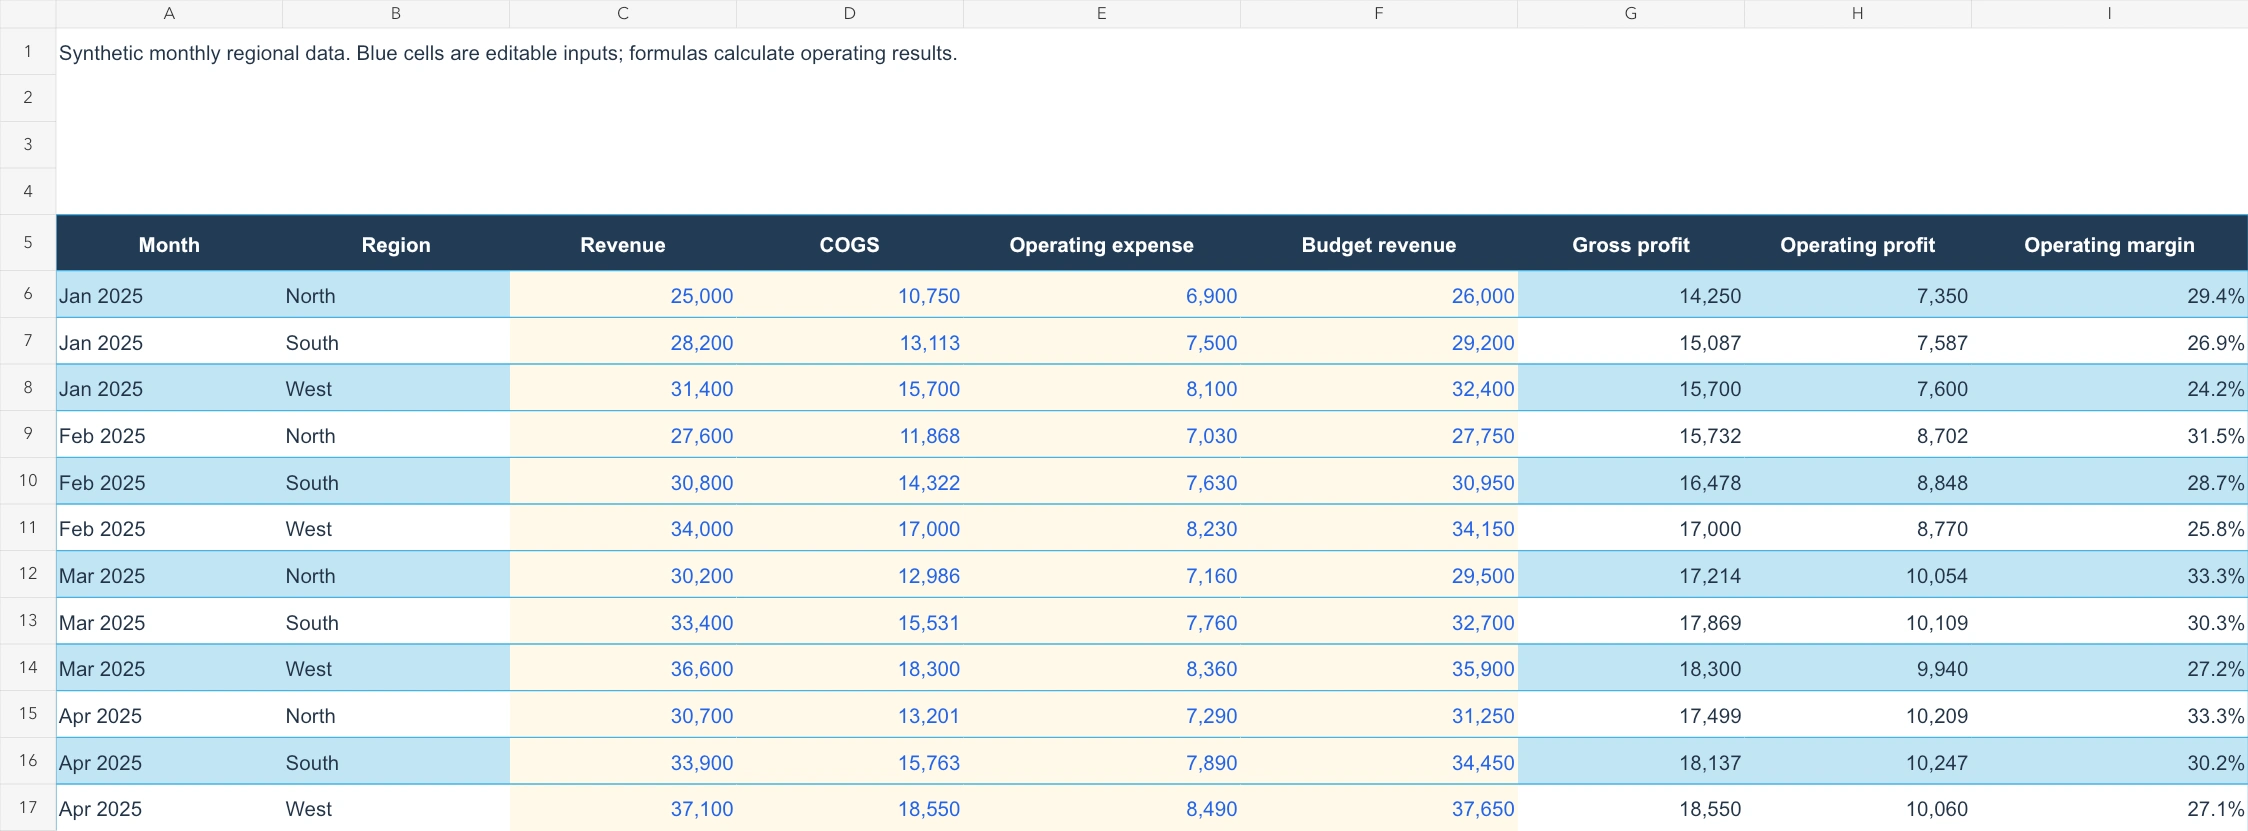
Monthly inputs sit on one sheet; the dashboard reads from it through formulas only. The monthly table shows revenue, budget, variance, operating profit and margin, with negative variances highlighted. Operating profit is revenue minus cost of goods sold and operating expense.
Tools
Microsoft Excel; AI-assisted build and checks.
Deliverables
One workbook with a Dashboard sheet and a Monthly Data sheet.
Results
The link between inputs and dashboard was tested by changing a revenue input, confirming that totals and the chart updated, and restoring it. This is descriptive reporting on sample data, not financial advice.
0 likes · 0 views · Oct 11, 2026
Independent sample: monthly revenue, budget variance and operating margin in an Excel dashboard with traceable formulas.
