
Overview
An independent sample Excel workbook for sales and replenishment decisions. All data is synthetic; this is not a paid client project.
Objective
Show revenue, gross profit and margin by product and month, and connect sales to stock levels.
My role
I defined the structure and the KPIs, built the workbook with AI-assisted tooling, and reviewed and tested the totals.
Approach
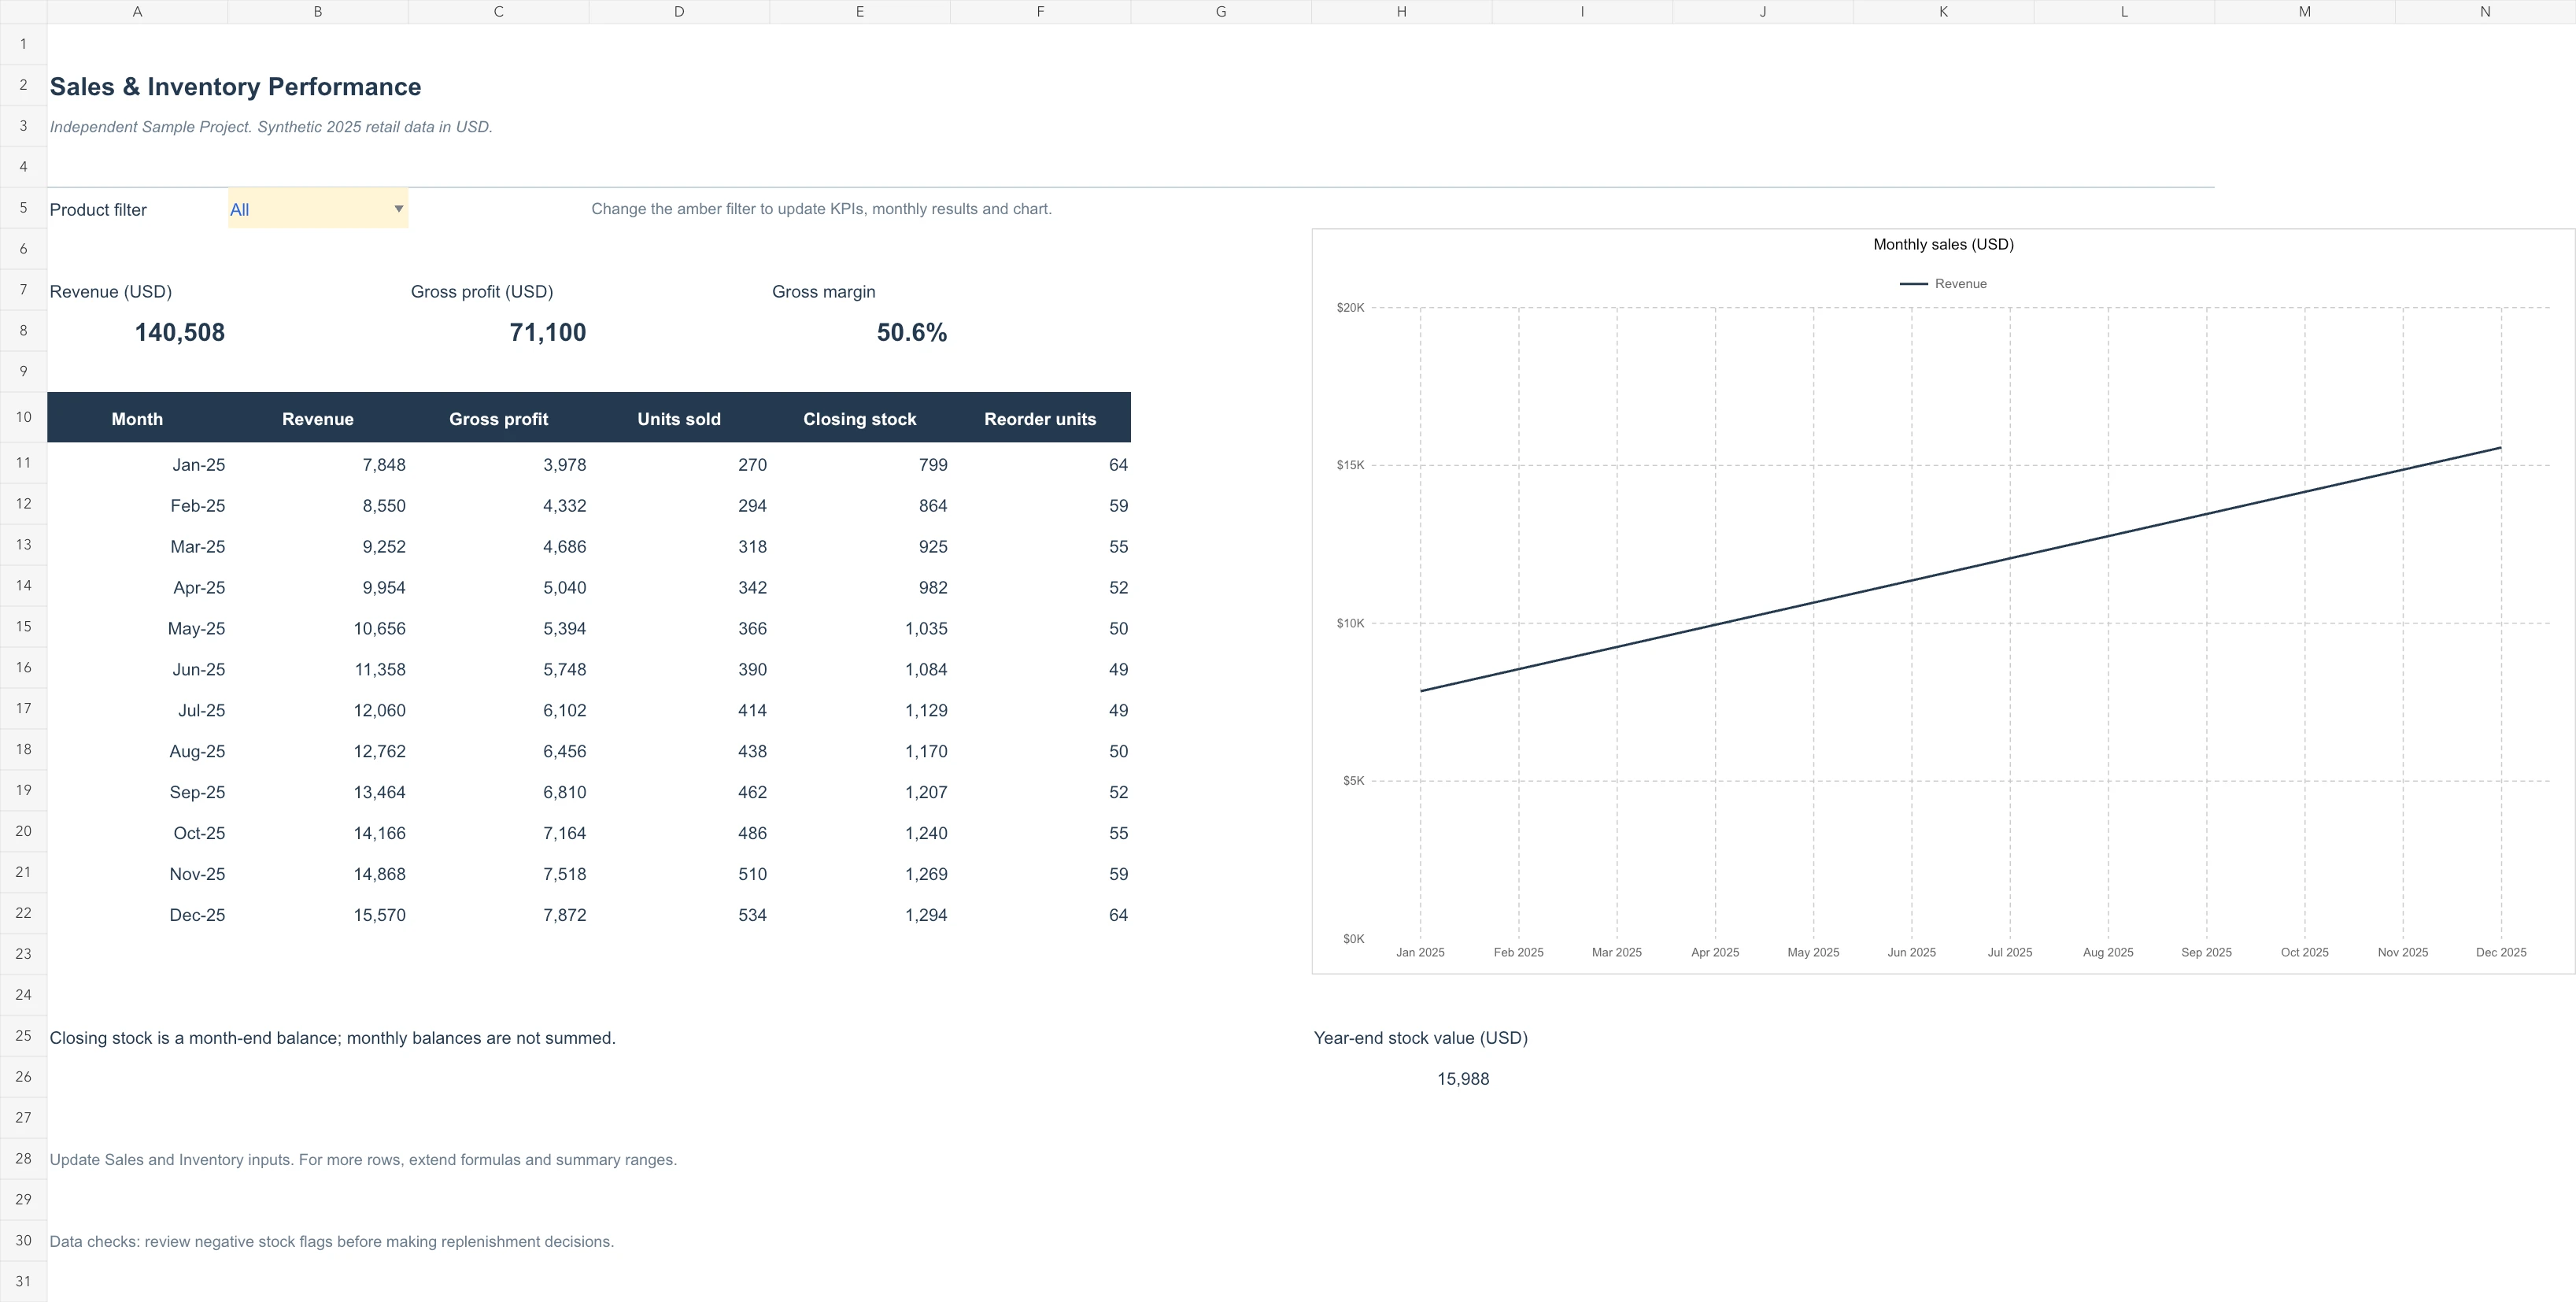
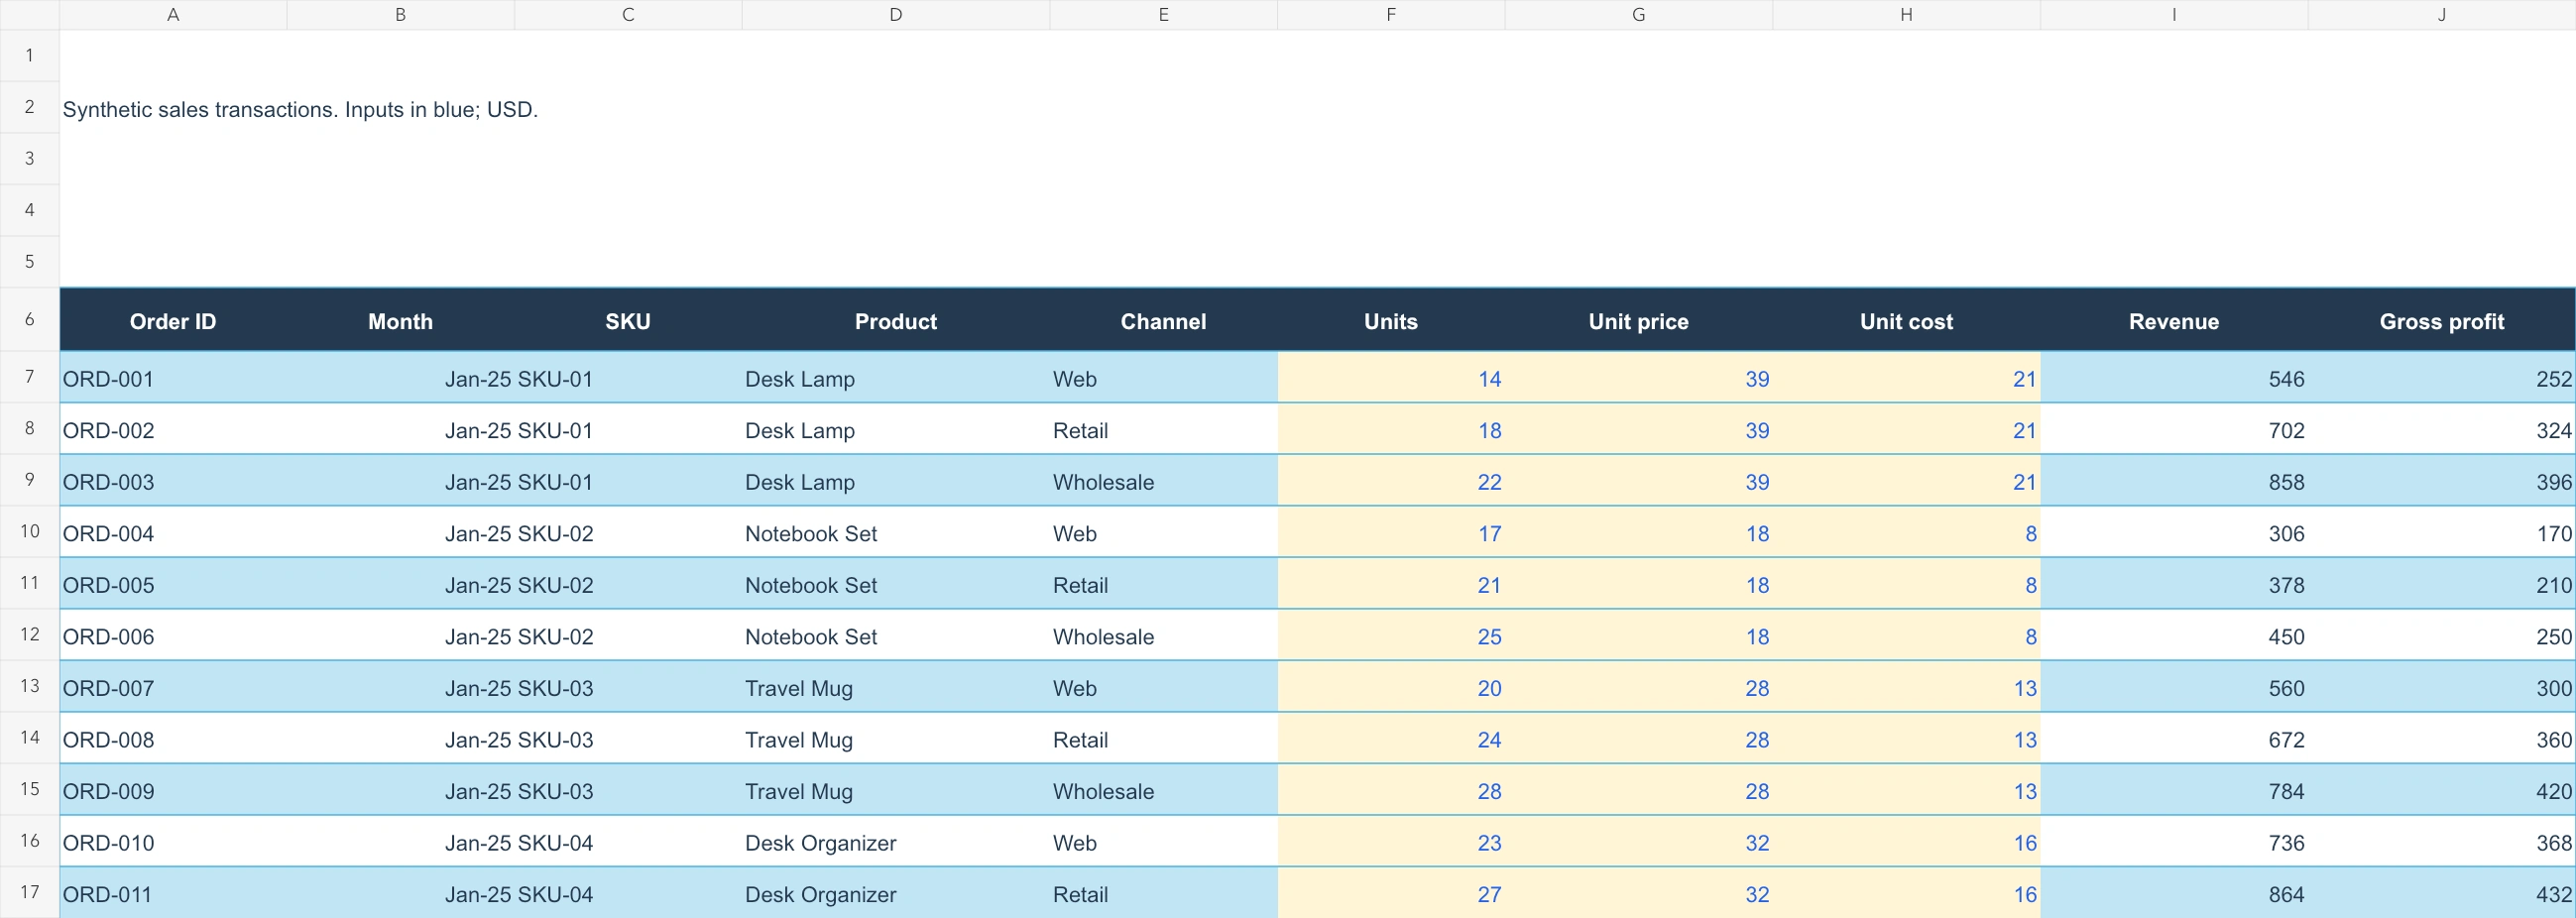
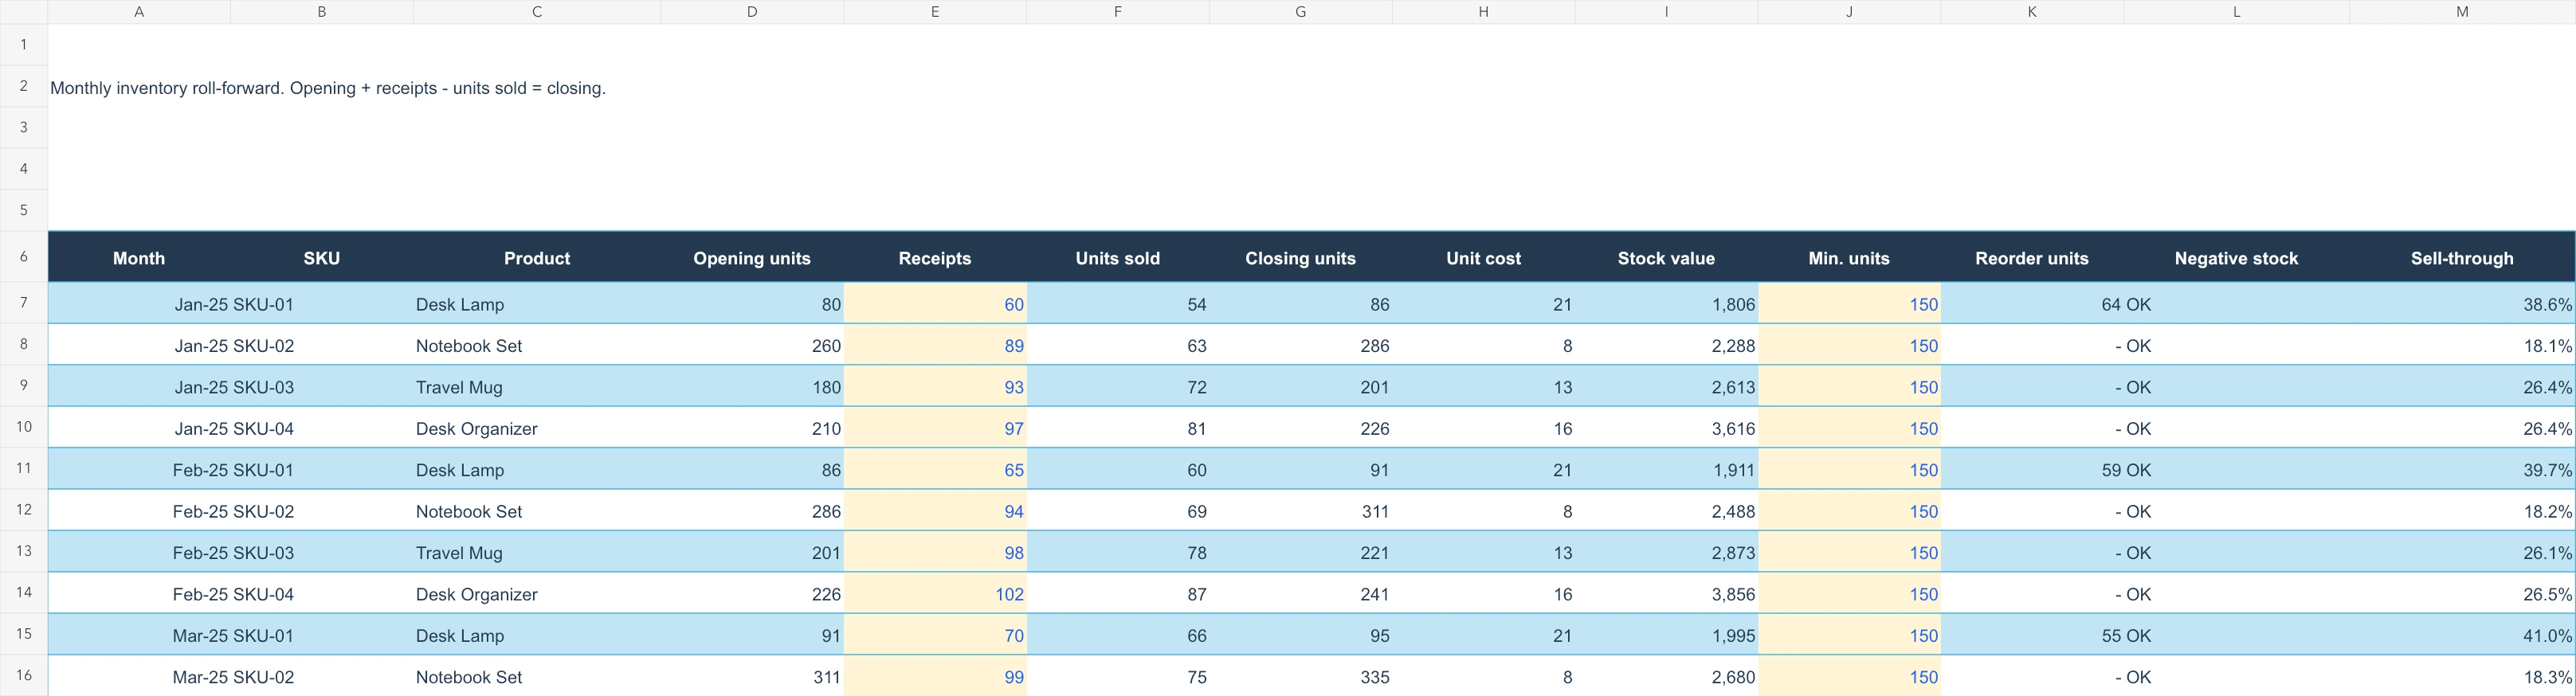
144 orders across four products and 12 months feed a dashboard. Selecting a product updates revenue, gross profit, margin and the monthly table and chart. A linked inventory roll-forward tracks closing stock, sell-through and reorder quantities.
Tools
Microsoft Excel; AI-assisted build and checks.
Deliverables
One workbook with dashboard, sales and inventory sheets, with editable inputs and data checks.
Results
Totals, stock balances and product-filter recalculation were tested. No client engagement or commercial result is claimed.
0 likes · 0 views · Oct 11, 2026
Independent sample: Excel KPI dashboard with a linked inventory roll-forward, built on 144 synthetic orders.
