
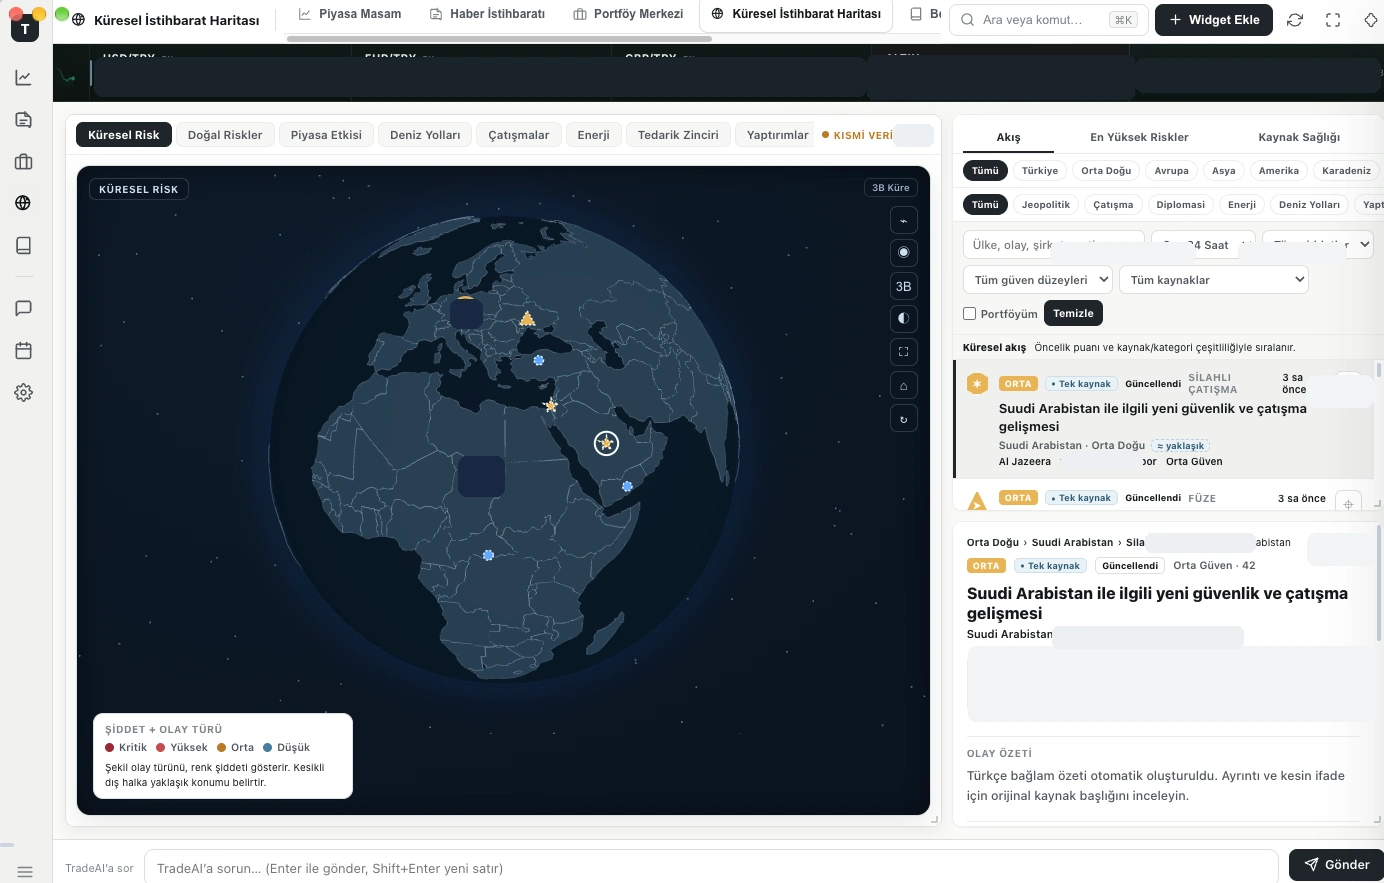
Actual TradeAI interface. Privacy-redacted screenshot; some content is intentionally concealed. This is not a fictional demo dataset.
Project overview
TradeAI is my independent financial analytics and global intelligence application. It brings together financial visualization, portfolio dashboards and global risk monitoring.
Problem and approach
Financial and geopolitical information is often spread across separate sources and interfaces. The product explores how a structured workspace can make that information easier to navigate and compare.
Functionality shown
The global intelligence view shows a geographic risk visualization, topic filters and an information feed. The broader product includes financial visualization and portfolio dashboards. This case study presents the interface and product concept; it does not claim investment performance or independently validated source coverage.
My contribution
I develop the product using AI-assisted workflows, combining finance knowledge with product requirements, interface iteration and testing. This is independent product work, not a paid client commission.
Solution
A unified workspace for geographic risk visualization, topic filters and an information feed, supported by financial and portfolio dashboards.
Technologies
The local TradeAI desktop project uses JavaScript/Node.js and Electron, with D3, Three.js and lightweight-charts for visualization. My role is independent project developer using AI-assisted requirements, interface iteration and testing.
Outcome
A working interface and independent portfolio project demonstrating structured financial information and visual reporting. No paid-client history, investment returns or business impact metrics are claimed.
0 likes · 0 views · Oct 7, 2026
Independent financial analytics application combining market visualization, portfolio dashboards and global risk monitoring in a unified workspace.
