This project presents an interactive
chandana A
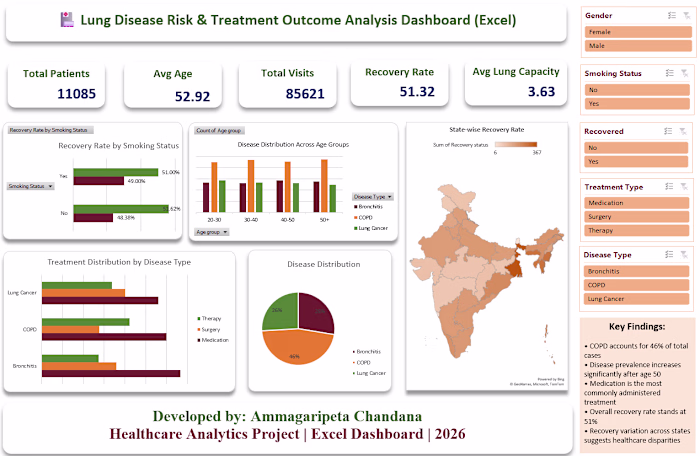
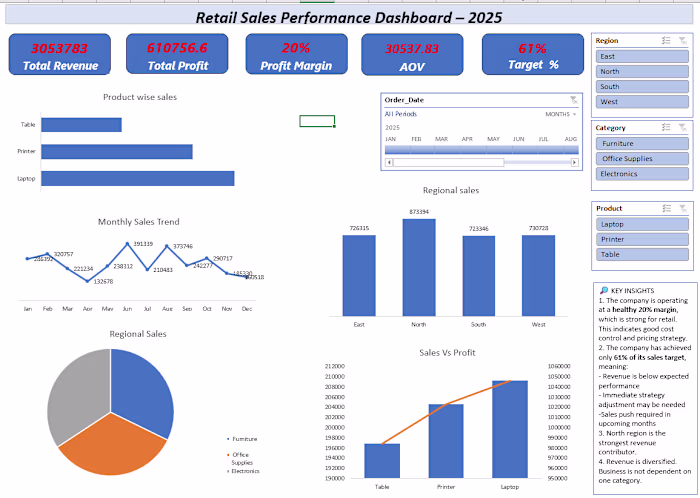
This project presents an interactive Sales Performance Dashboard built using Microsoft Excel. The dashboard analyzes key business metrics such as total sales, profit, profit margin, customer segments, and monthly sales trends.
The objective of this project is to transform raw transactional data into meaningful business insights using Excel’s analytical tools, enabling better understanding of sales performance across regions, categories, and customer segments.
Like this project
Posted Mar 4, 2026
This project presents an interactive Sales Performance Dashboard built using Microsoft Excel. The dashboard analyzes key business metrics such as total sales...
Likes
0
Views
0