EDA and Visualization of Indonesia Earthquake Over the past 20 …
Like this project
Posted Jun 28, 2024
Find patterns in earthquakes that occur using seismic activity data from Indonesia’s region, one of the top regions that have high earthquakes activity, with o…
Likes
0
Views
14
EDA and Visualization of Indonesia Earthquake Over the past 20 years
Introduction
Indonesia is a country with high rate of natural disasters, such as volcanic eruptions, forest fires, floods, and, most notably, earthquakes. It is quite often for the population there to receive, earthquake notifications from Meteorological, Climatological, and Geophysical agencies' applications. And it can get sometimes two or three notifications in one day, notifying users that there has been an earthquake in one of Indonesia's regions. Naturally, there will be immense data because of this, therefore, I thought of creating an EDA (Exploratory Data Analysis) on earthquakes that occurred in the Indonesia region over the last 20 years, and discover their patterns.
Earthquakes are known as one of the most destructive natural disasters, capable of destroying nearby towns in a split second with no warning. A Tectonic earthquake is one of the natural phenomenon caused by the movement of the earth’s crust. A Tectonic earthquake is the most frequent type of earthquake[1]. Earthquakes intensity can be recorded and measured as an earthquake's magnitude. The magnitude can be recorded using seismograph with the output of earthquake power in Richter scale[2].
The Indonesian archipelago is located on the tectonic zone where the Pacific, Eurasian, and Indo-Australian plates collide. Because Indonesia is at the center of a complex tectonic zone, earthquakes occur almost every day more than three times[3]. According to data from the USGS (United States Geological Survey) website, 90 % of earthquakes, including the largest, occurred along the Ring of Fire region[4]. Surprisingly, Indonesia is located above the ring of fire and the complex tectonic zone.
The EDA and data visualization can be used to visualize, earthquake's nature, and understand potential patterns in this historical data. I used the R programming language to perform an EDA and a visualization of the data to be able to get a deeper insights. The dataset was gathered from USGS website, which collects data on earthquakes that occur around the world[5]. Earthquake's data is between 2000 to 2020.
EDA and Visualization
The majority of the data in the dataset comes from earthquakes recorded in ASEAN countries. Thus, the coordinates of the Indonesian territory were specified in the code so that the data can only be filled with earthquakes occurred in the Indonesian region.
Thereafter, a classification of earthquakes based on their magnitude was necessary.
Based on the magnitude richter scale suggests, an earthquake is classified in eight categories[6].
Magnitude less than 2: Micro Earthquake
Magnitude 2 to 3.9: Minor Earthquake
Magntiude 4 to 4.9: Light Earthquake
Magnitude 5 to 5.9: Moderate Earthquake
Magnitude 6 to 6.9: Strong Earthquake
Magntiude 7 to 7.9: Major Earthquake
Magntiude 8 to 9.9: Great Earthquake
Magntiude more than 10: Epic Earthquake
This analysis only includes earthquakes with magnitudes greater than 2 on the Richter scale.
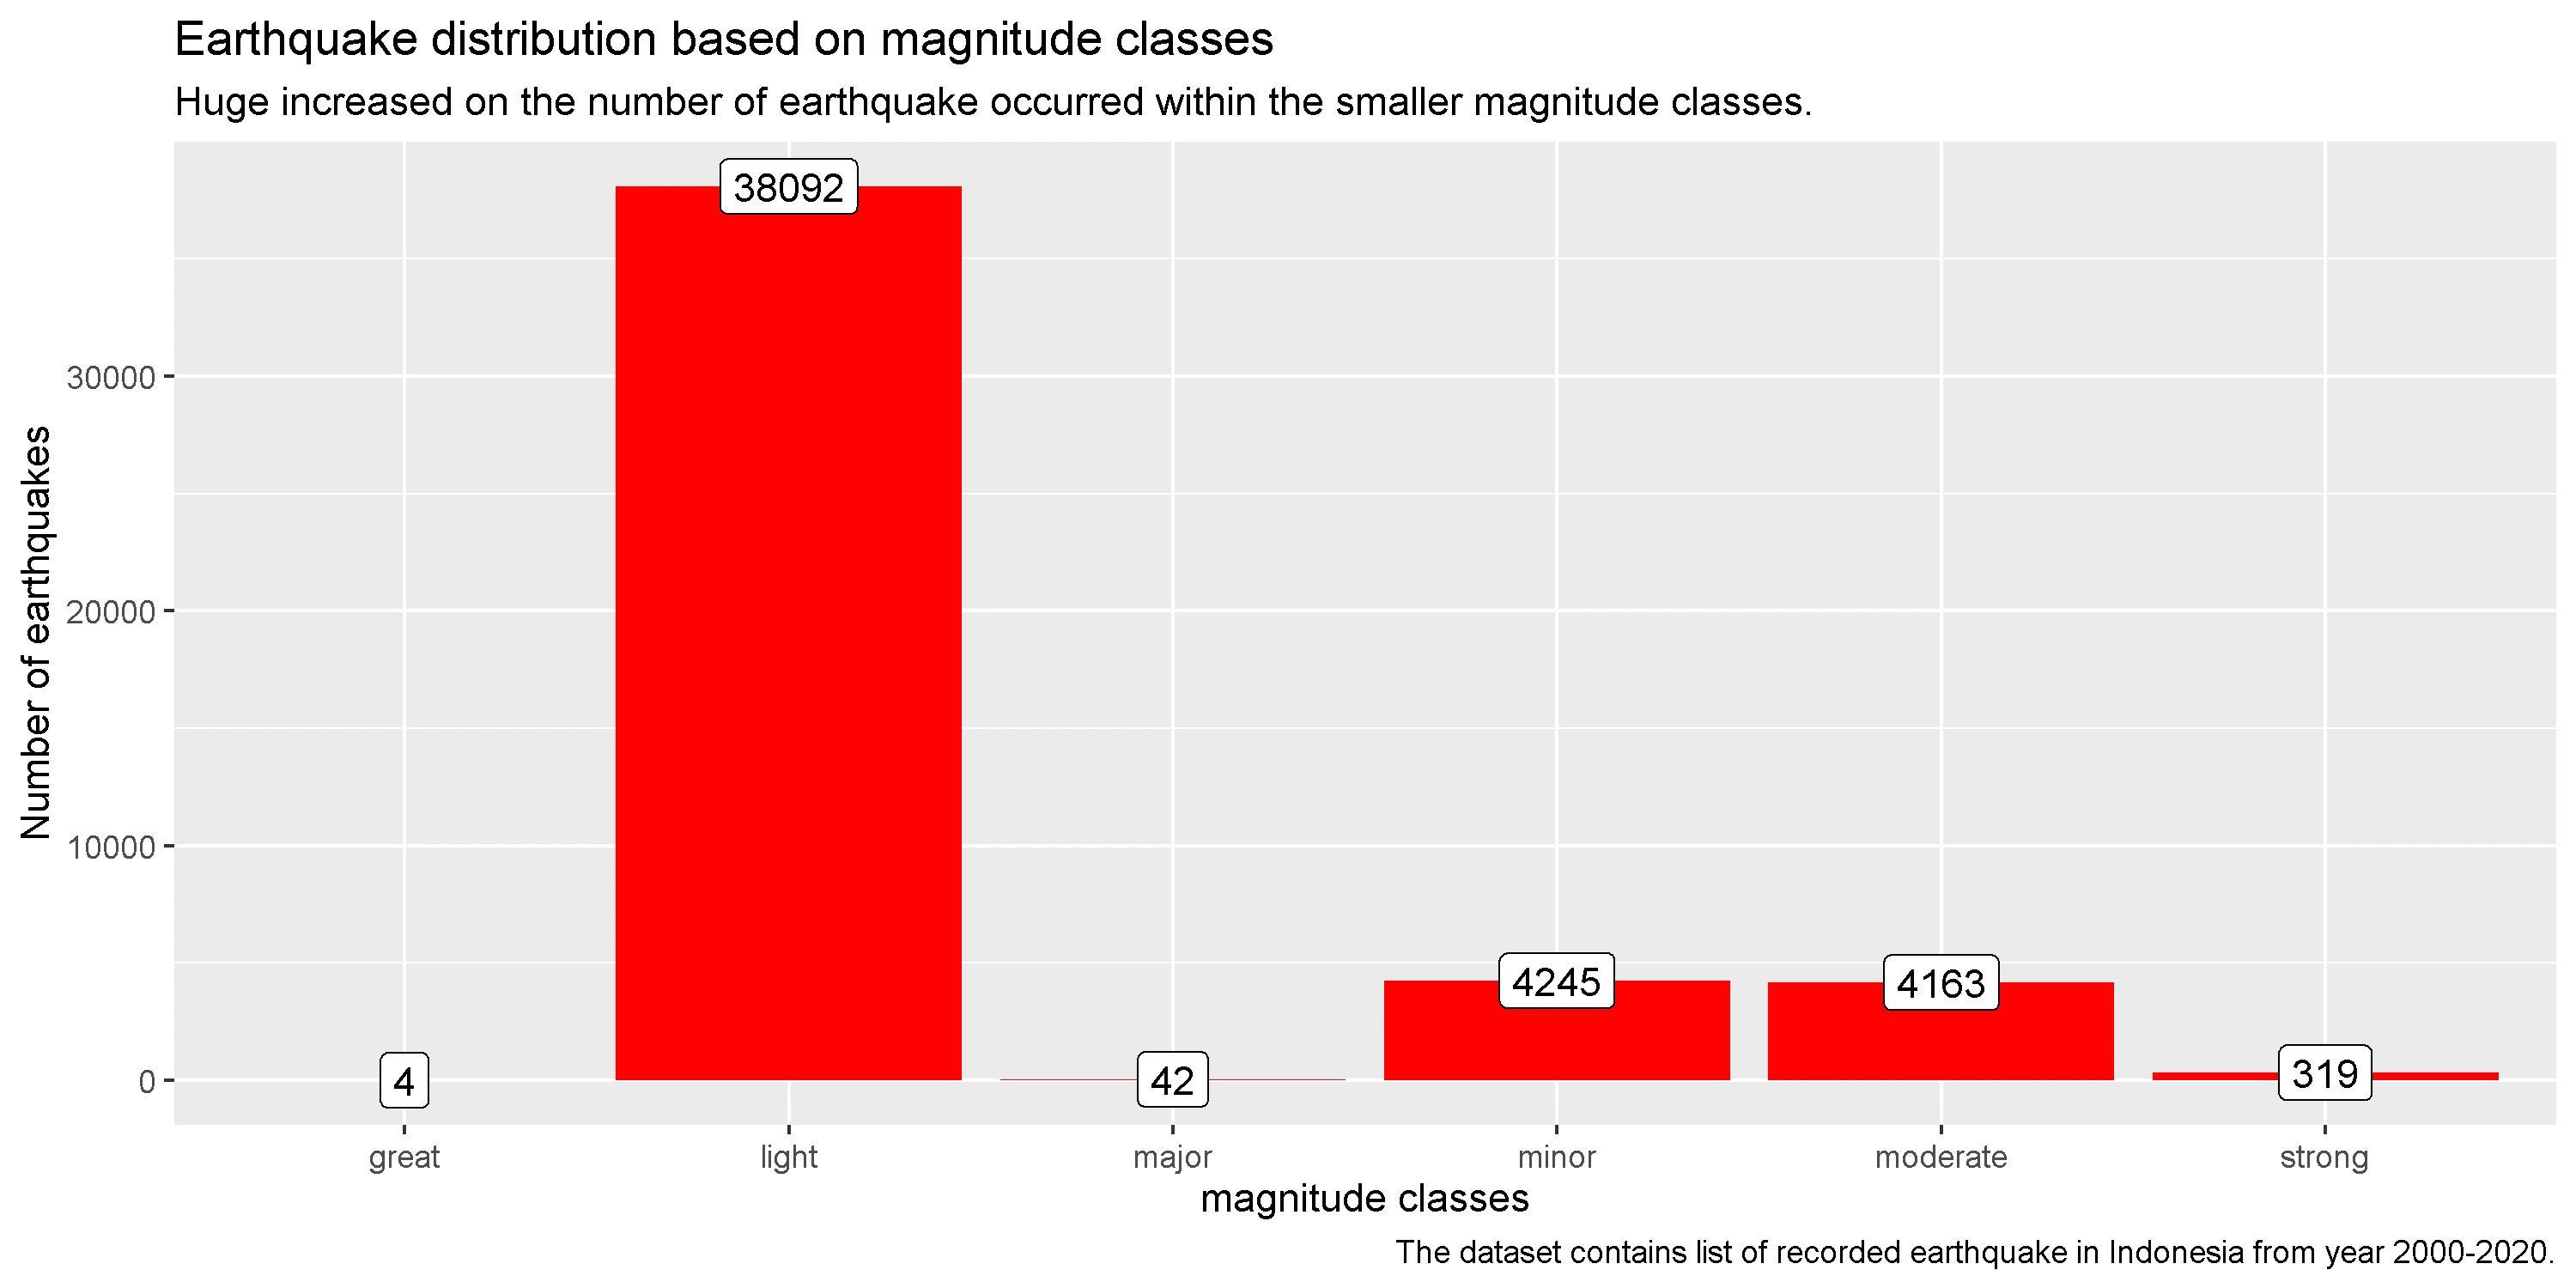
Fig. 1 Earthquake distribution by magnitude
According to the bar chart of Fig 1. above, there are over 4245 "minor" earthquakes, 38092 "light" earthquakes, and 4163 "moderate" earthquakes occurred on Indonesian territory between 2000 and 2020. The most concerning thing is that there are 319 "strong" earthquakes, 42 "major", and 4 "great" ones. The magnitude beyond "strong" tend to cause significant damage to the areas impacted. To get more specific data about when these earthquakes occurred, further more information about earthquakes needed of the occurence each year.
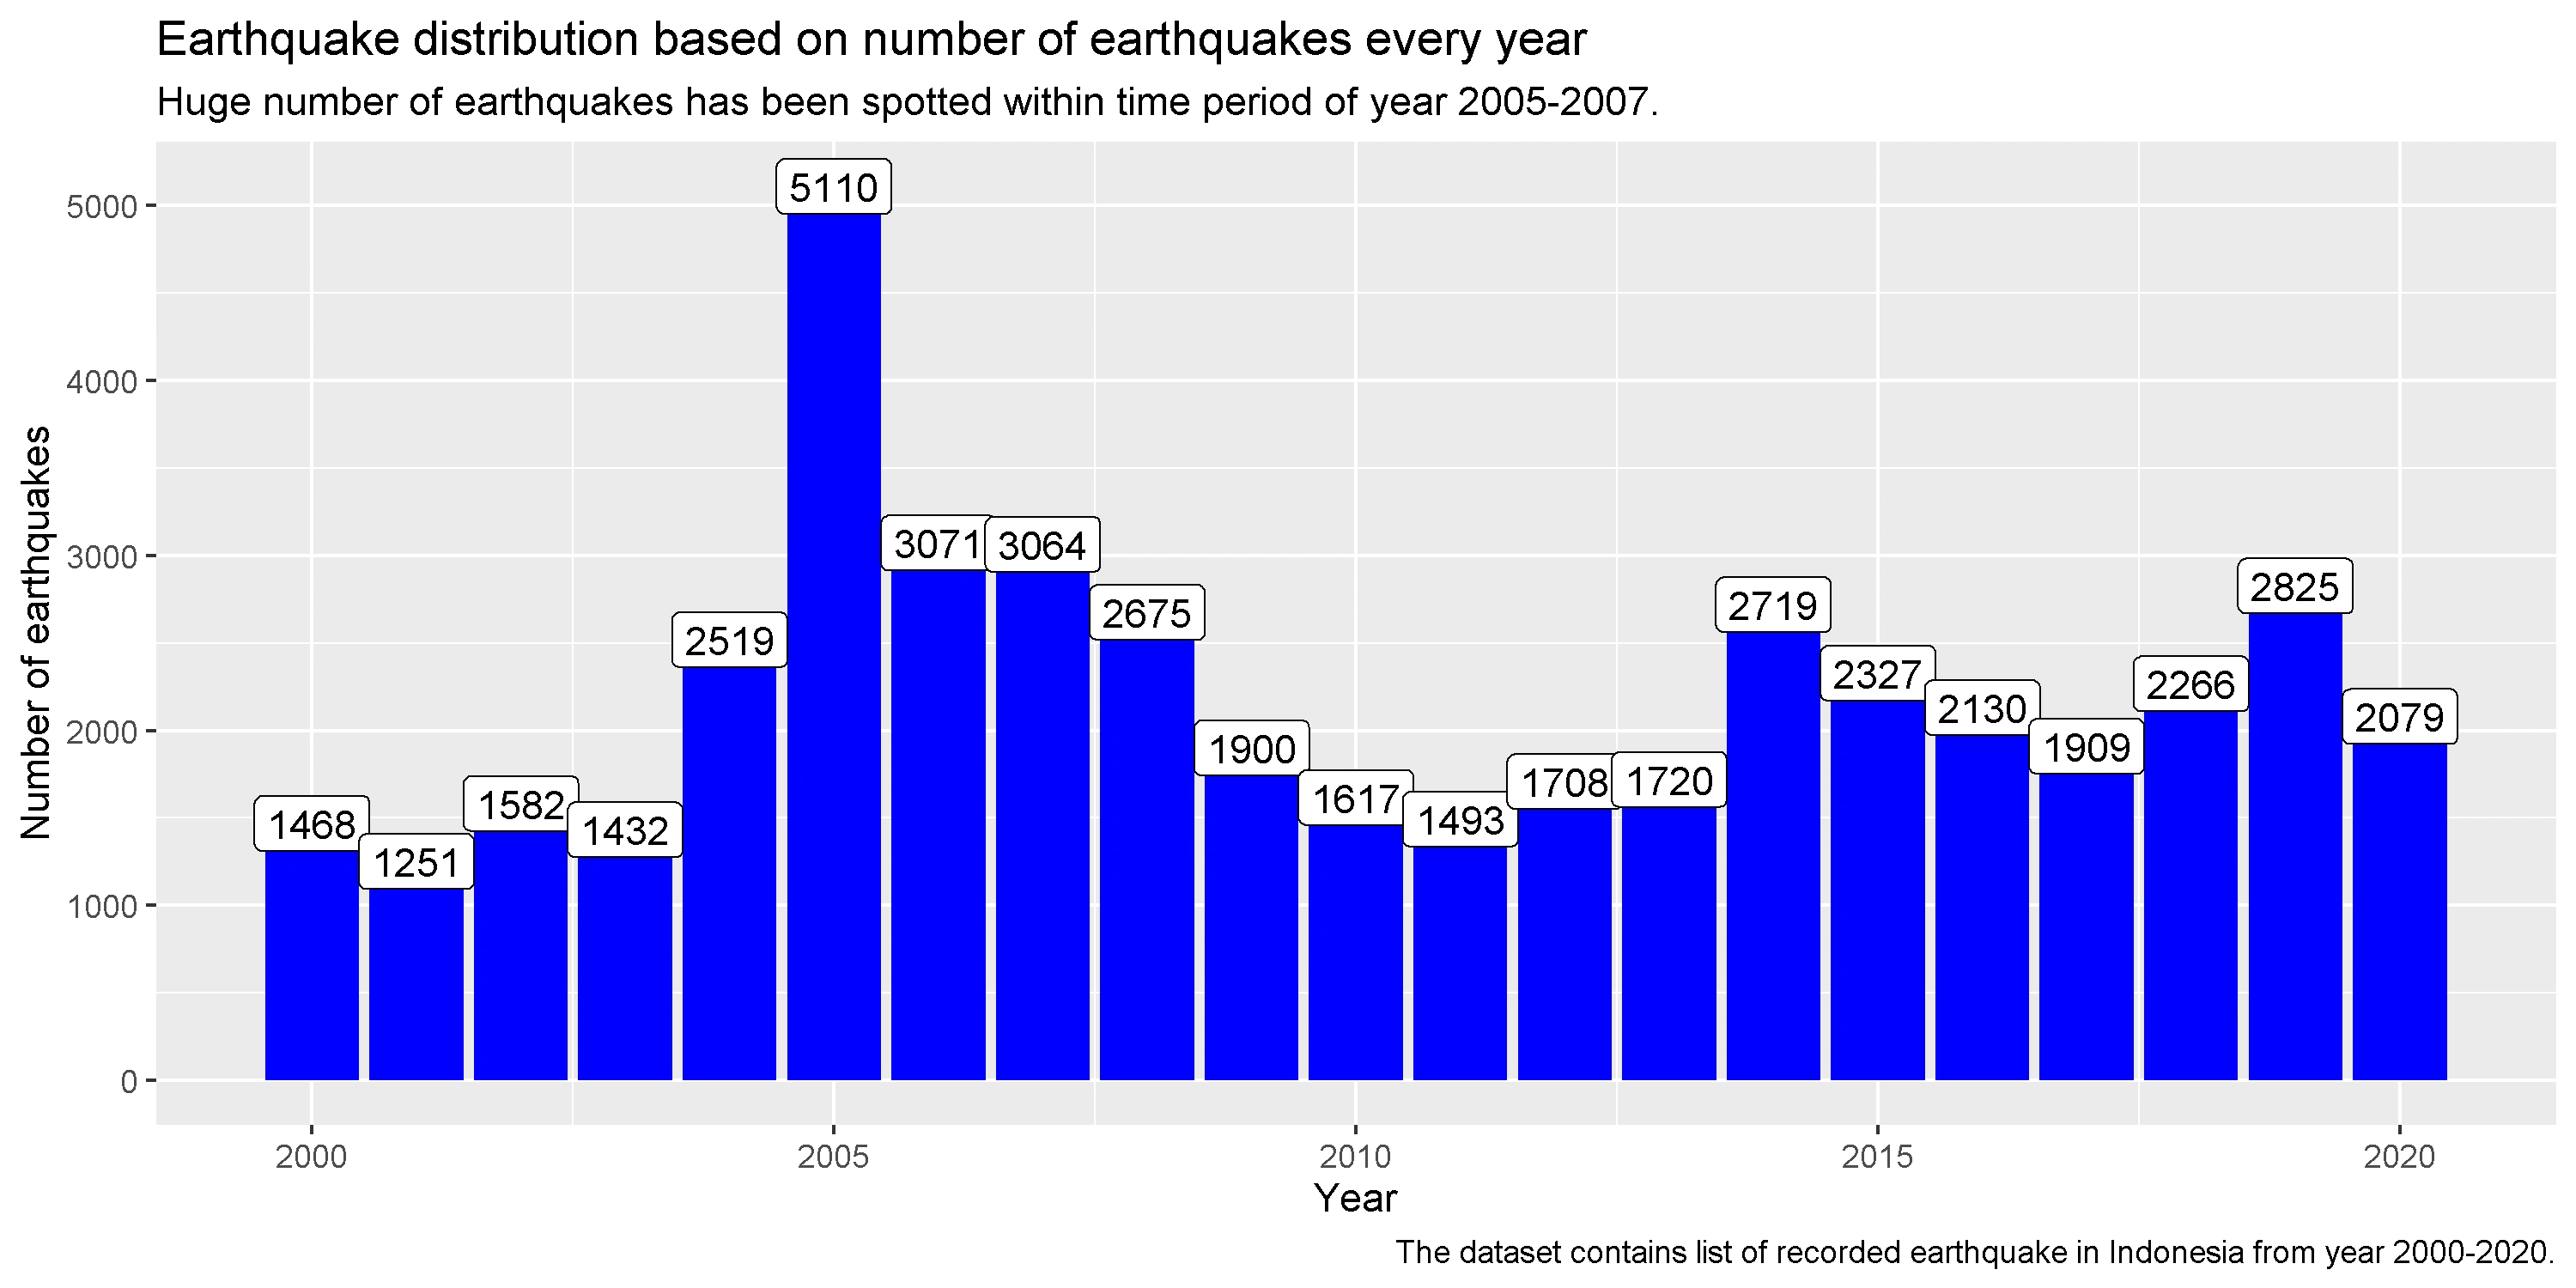
Fig. 2 Earthquake distribution per year
The bar chart of Fig 2. indicates that there were more than 1000 earthquakes occurence in Indonesia every year. There was also a significant increase in the number of earthquakes in 2005, with over 5110 earthquakes occured in that year alone. The 2005 earthquakes are the double the number of earthquakes recorded from previous year.
Through this data, a hypothesis then sugests that the increase of the number of "minor" earthquakes, was because of the major earthquake that occured before the increase's period, which as an almost a year difference. A scatter plot to gather more information about the earthquakes distribution by magnitude scale and time period, which may help strengthen the hypothesis' argument.
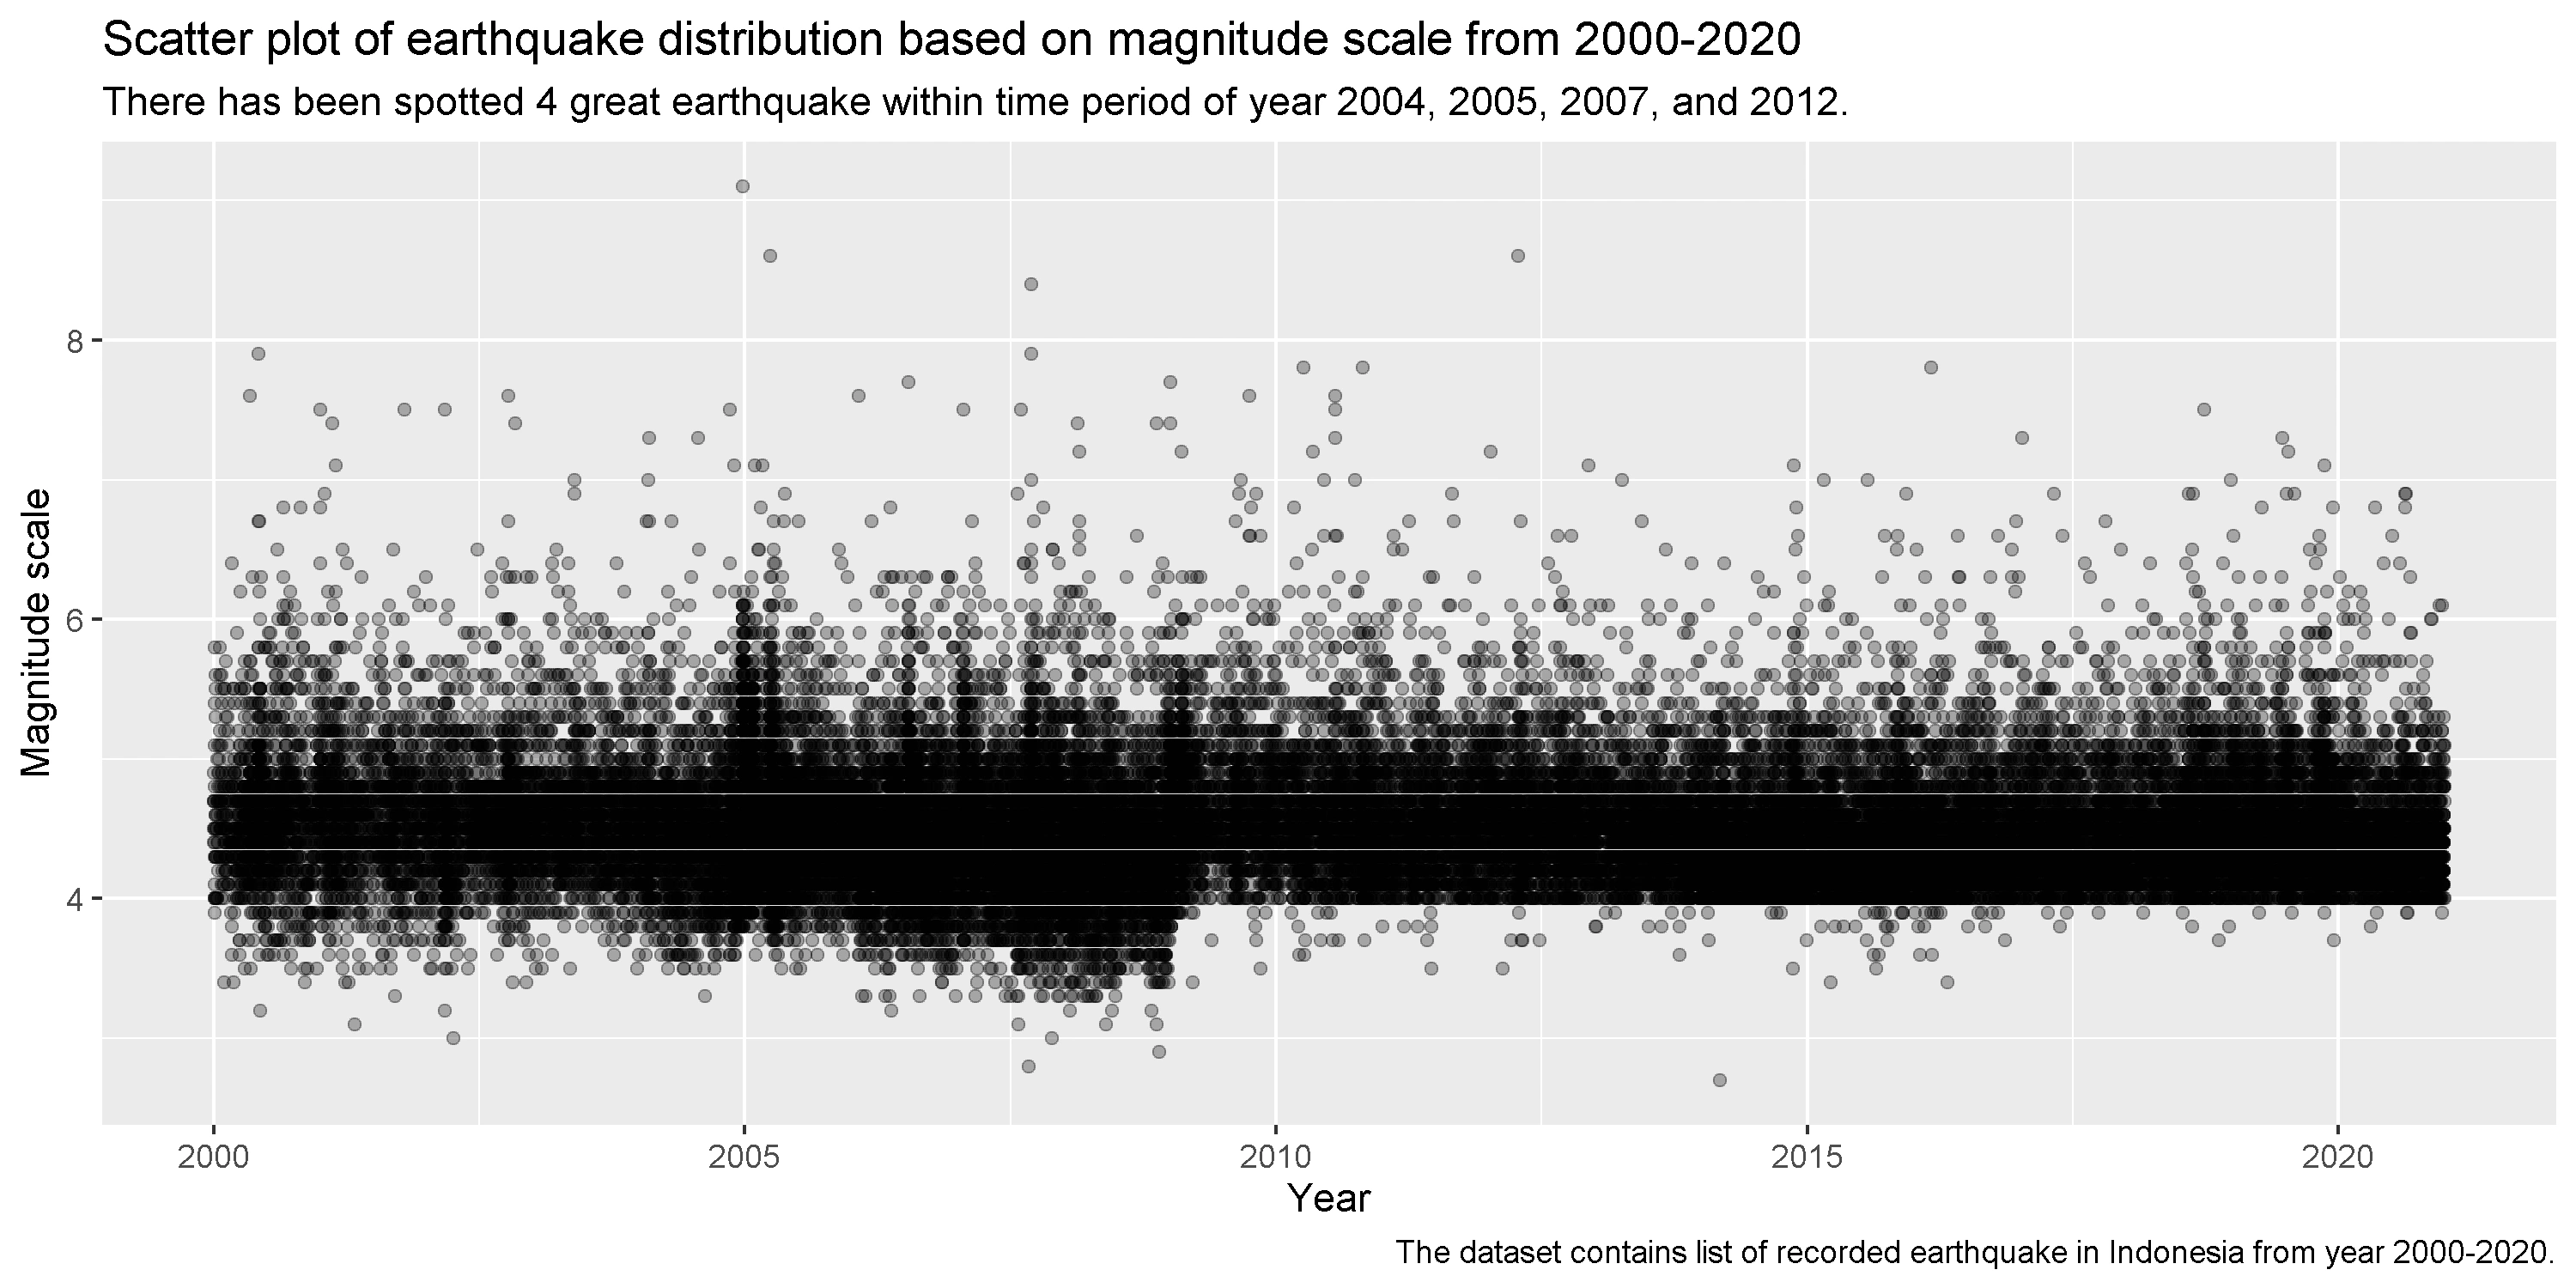
Fig. 3 Scatter plot of earthquakes distribution by magnitude between 2000-2020
The scatter plot from Fig 3. above shows that there were three major earthquakes between 2004 and 2007, which where the focus will be moving forward.
According to media news, the Sumatra-Andaman earthquake with a magnitude of 9.1 on the Richter scale occurred in December 2004. This earthquake occurred on a tectonic subduction zone where the India plate, as part of the Sunda plate, is subducted beneath the Burma microplate[7].
Following the December 2004 "great" earthquake, the next "great" earthquake occurred four months later in March 2005. This earthquake occured prior to the effect of the December 2004 "great" earthquake with a magnitude of 8.6[8].
The third "great" earthquake occurred on September 2007 in which there were one "great" earthquake with magnitude of 8.4, and one "major" earthquake with magnitude of 7.9 occured in the same day[9].
This massive earthquake is then, the primary cause of the significant increase in the number of minor earthquakes following it. Now on over, the focus will be on this time period of "2004 to 2007", where mainly the sequence of "great" earthquakes occured.
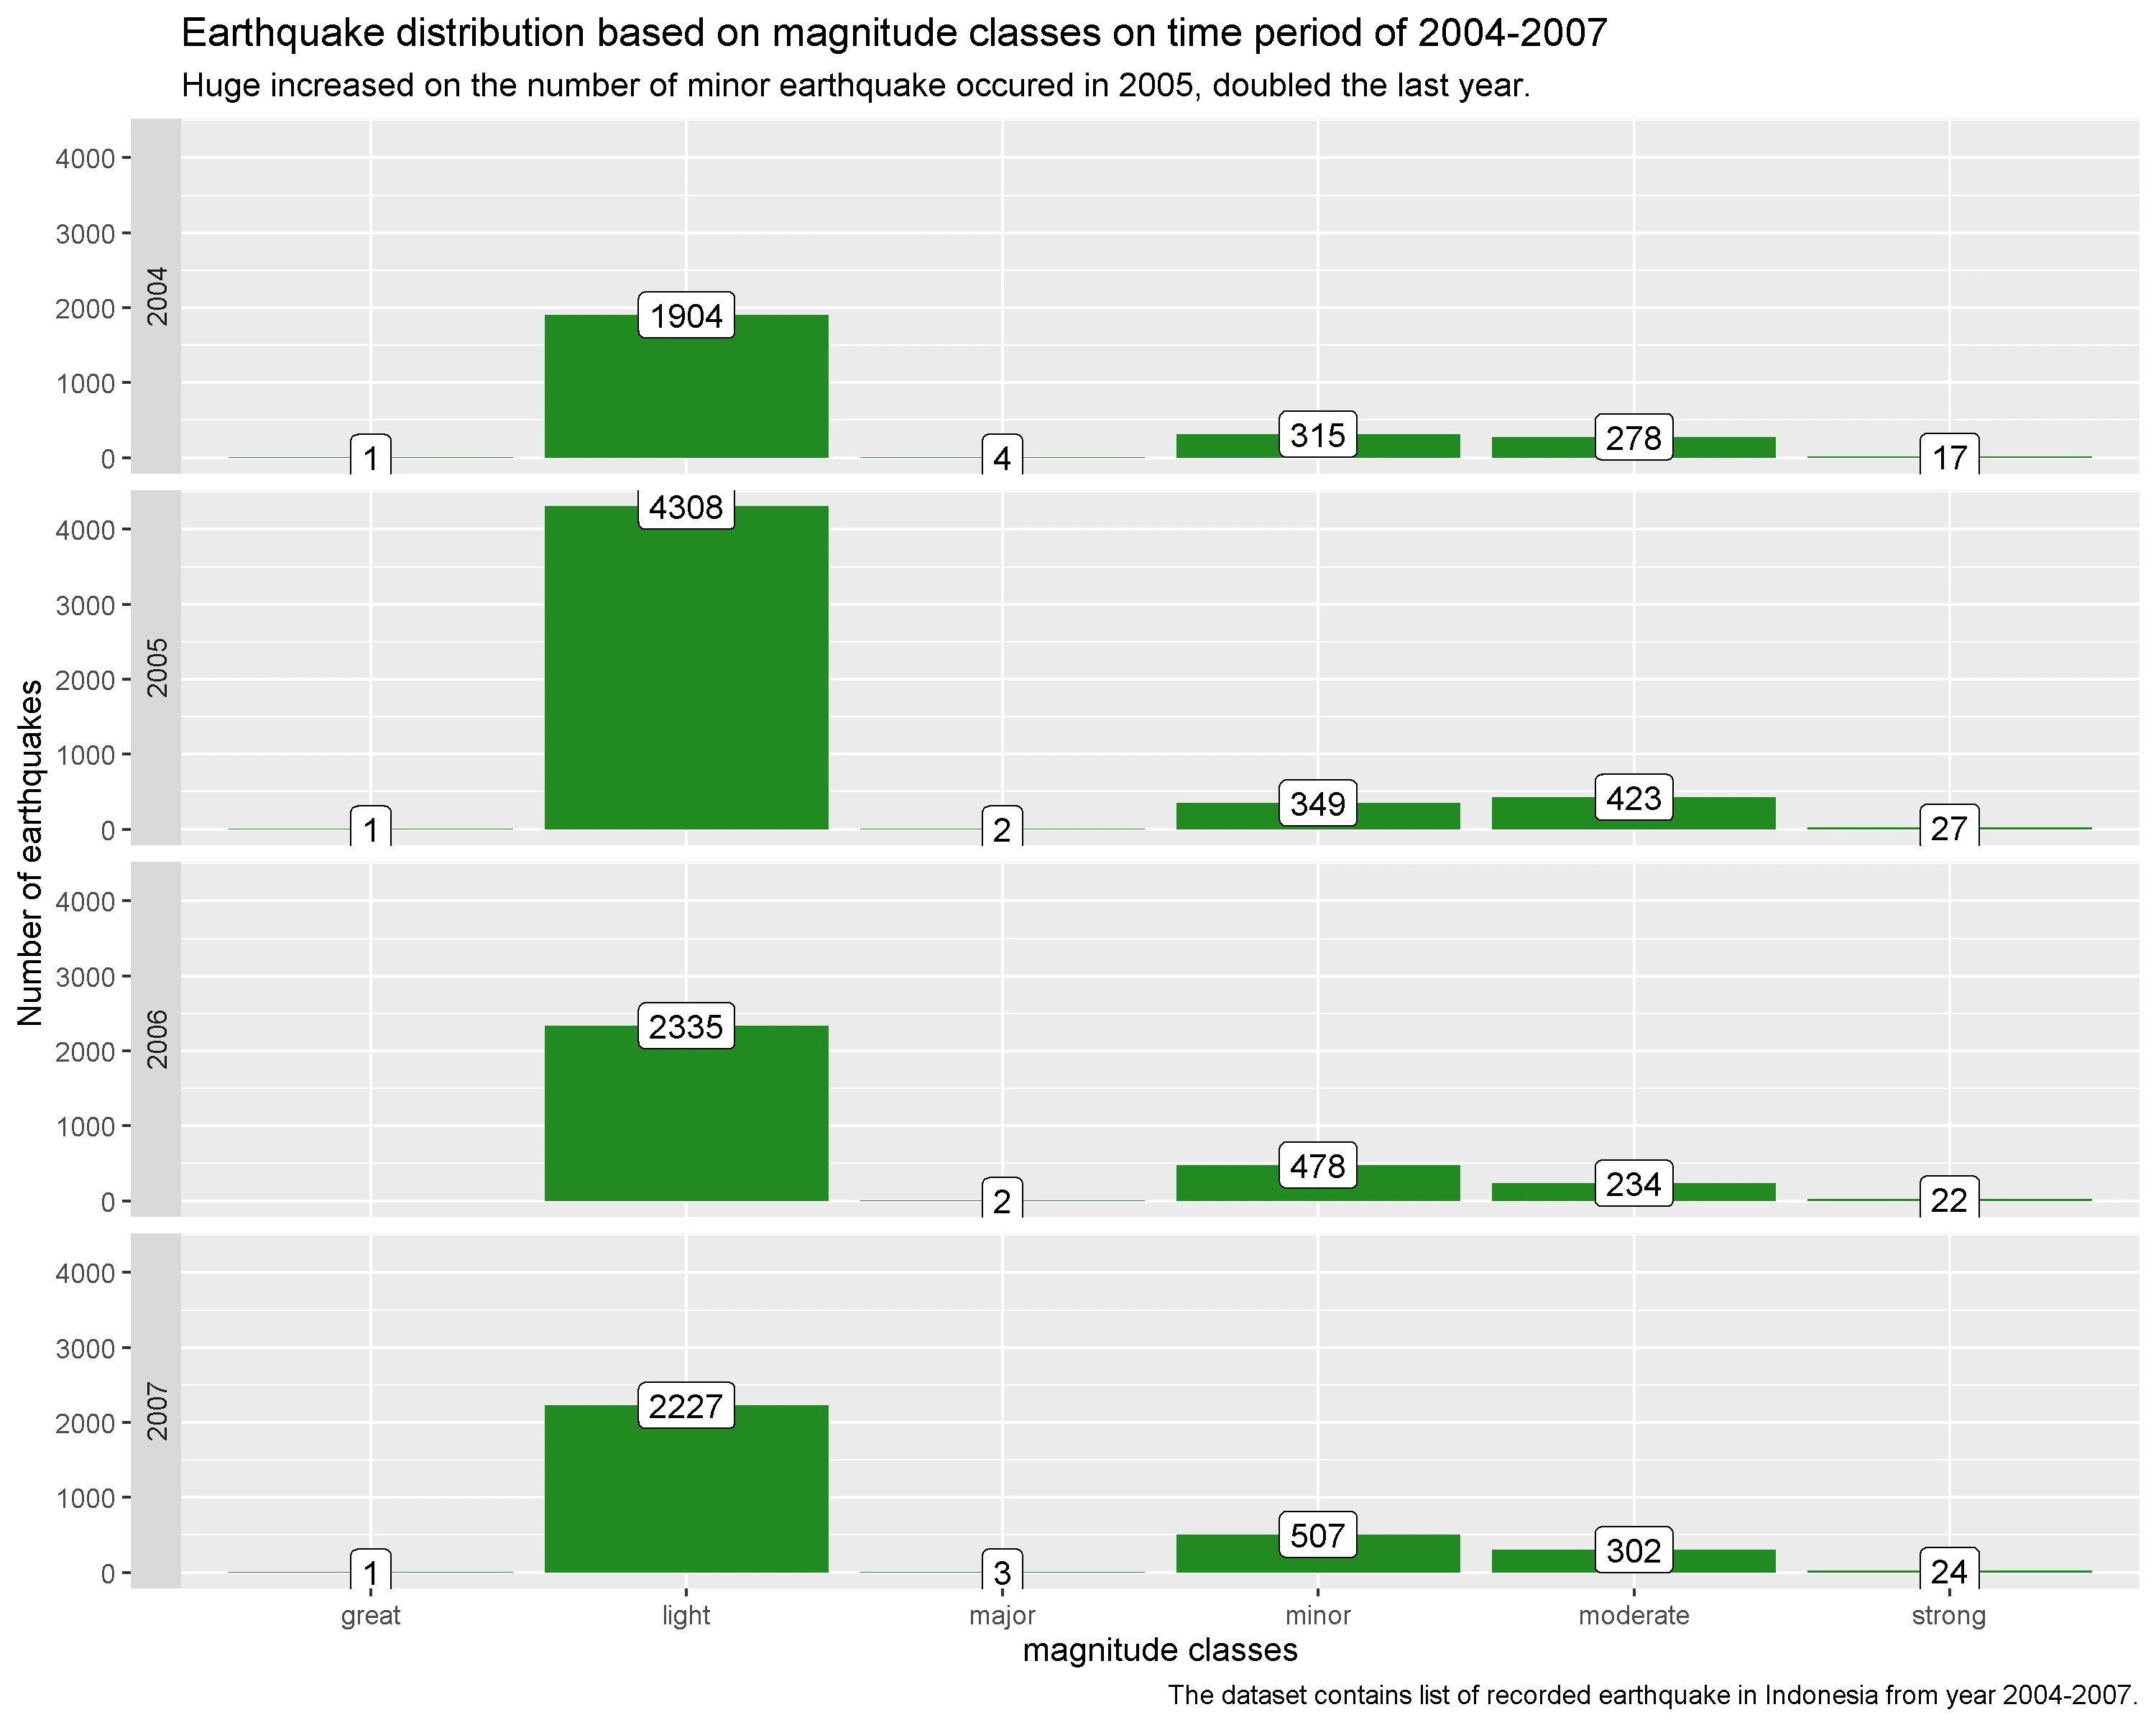
Fig. 4 Earthquake distribution by magnitude in 2004-2007
Based on the bar chart of Fig 4. The "great" earthquake in December 2004, and the second great earthquake in March 2005 caused a significant increase in "light" earthquakes in 2005. To get more information about the distribution of earthquakes per month, A further overview needed at the number of earthquakes that occurred per month from 2004 to 2007.
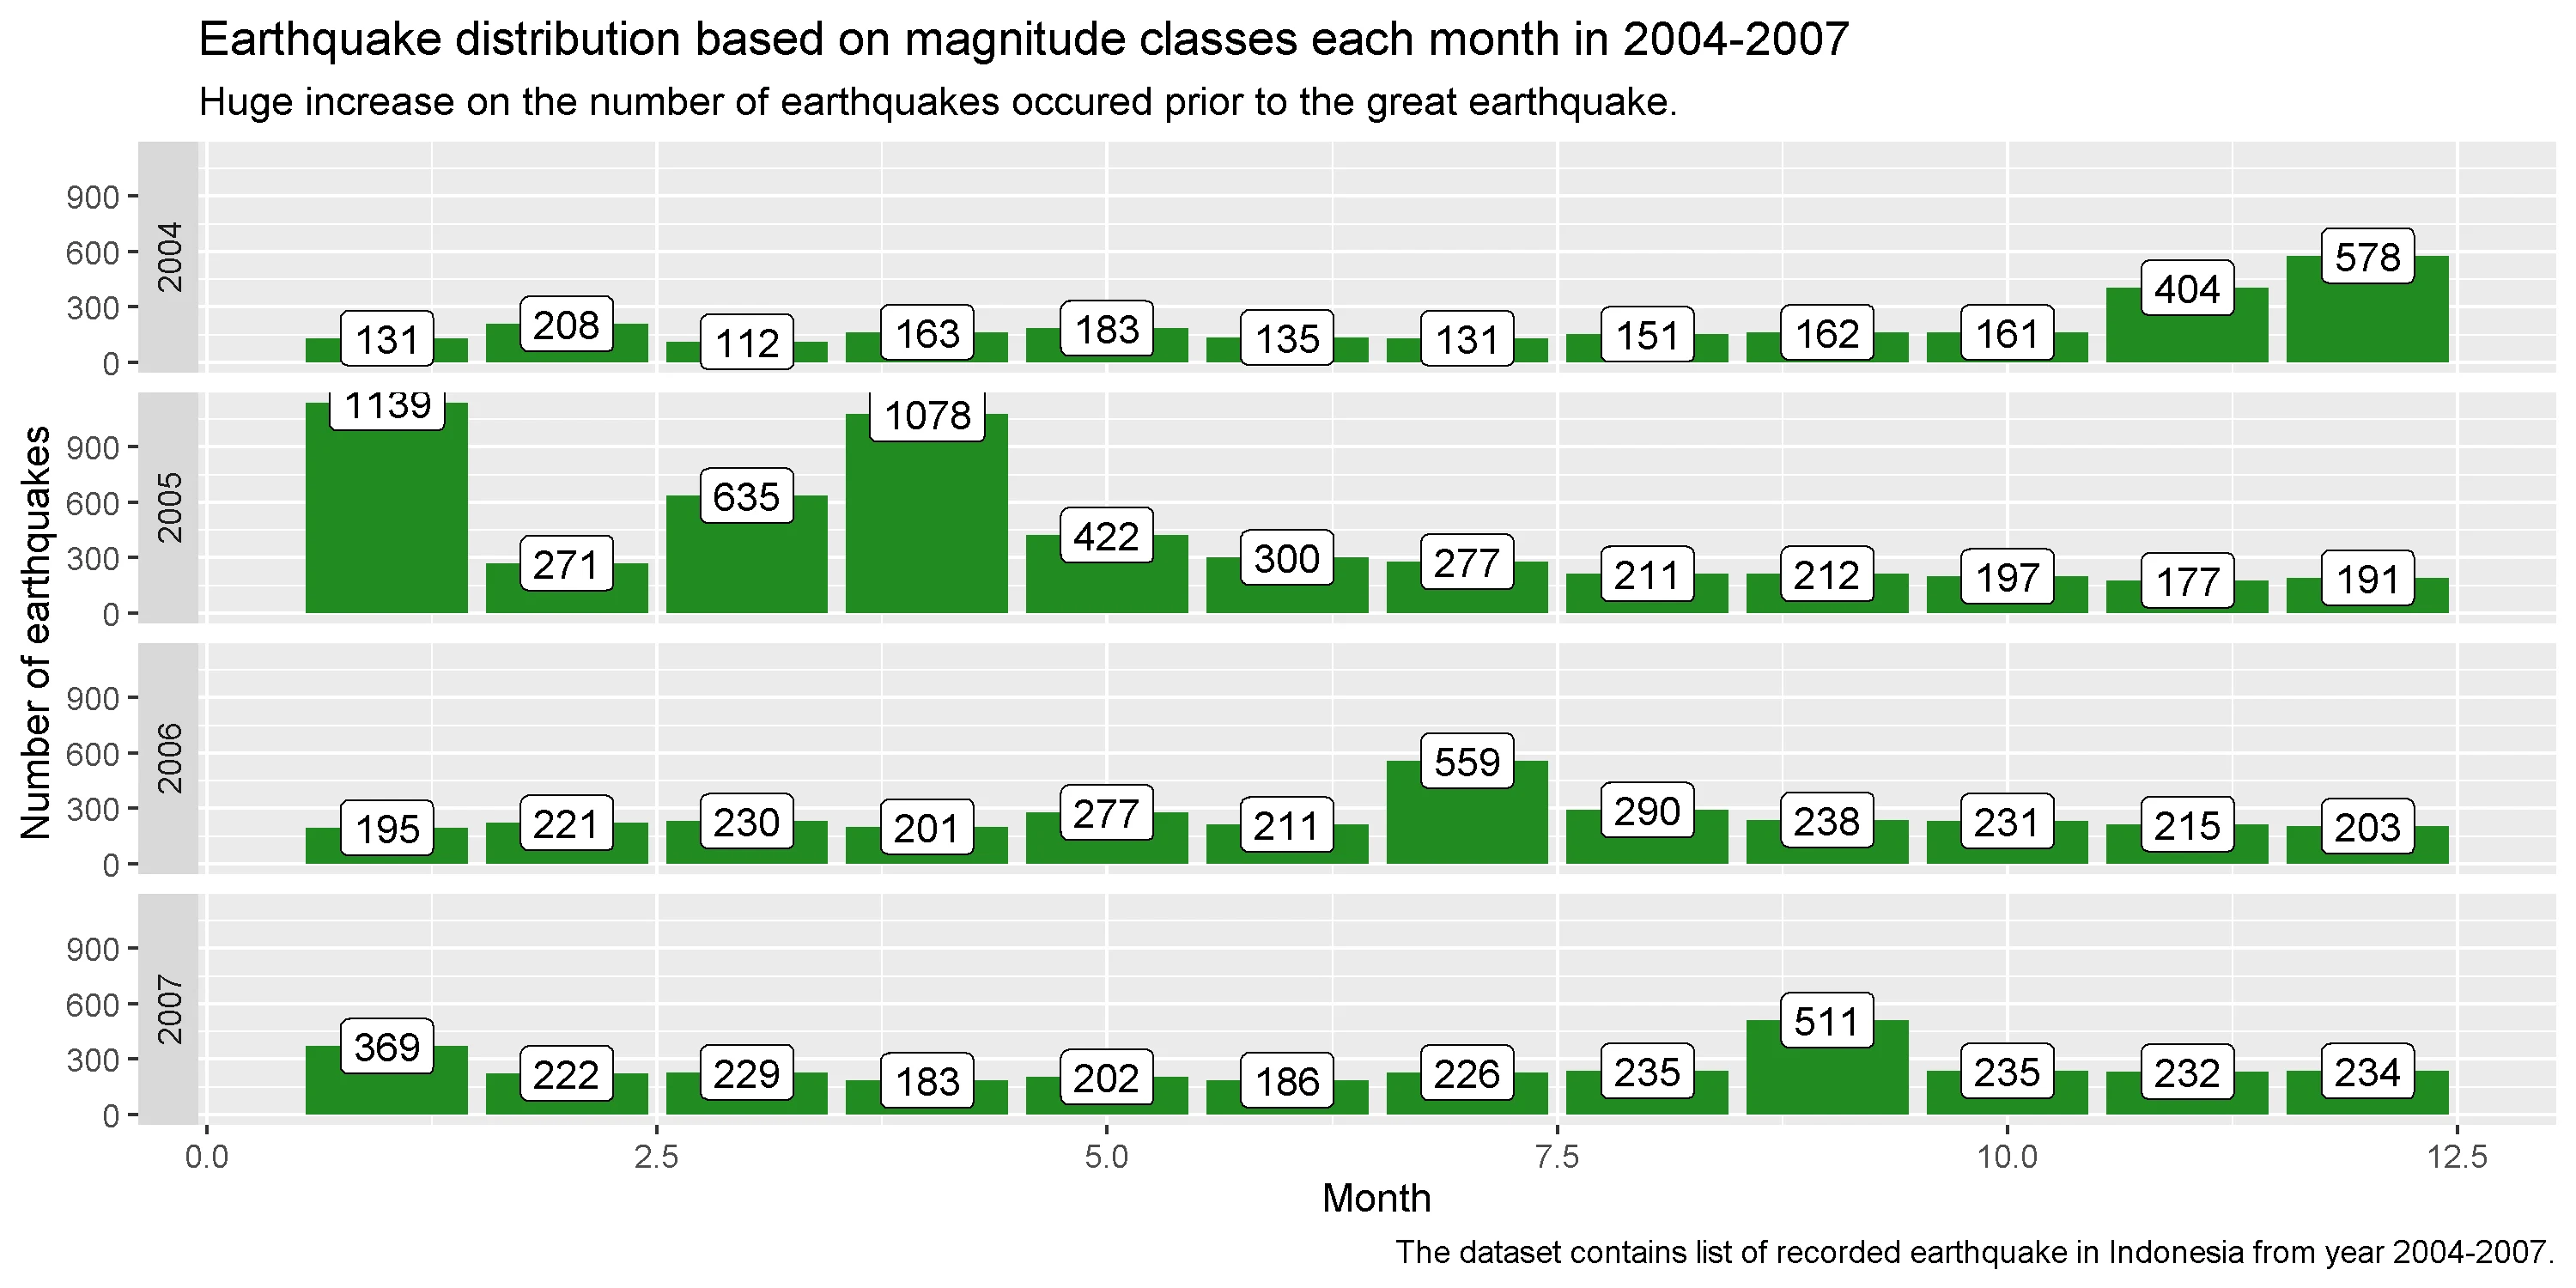
Fig. 5 Earthquake distribution by magnitude per month in 2004-2007
Through the bar chart in Fig. 5, the increase and decrease number of earthquakes per month from 2004 to 2007 will be easier to make sense of. Between December 2004 and April 2005, there were a large number of earthquakes. The earthquakes occurred prior to the "great" earthquake of 9.1 magnitude in 2004, which resulted in "minor" earthquakes in the following month.
There was also an increase in the number of earthquakes prior the second "great" earthquake in March 2005. Therefore, the previous hypothesis about the increasing number of minor earthquakes being caused by the "major" earthquake appears to be correct. According to the earthquake data from December 2004 to April 2005, the "great" earthquake that occurred a month before, caused a significant increase in the number of earthquakes in the following month.
The same pattern also happened when the third "great" earthquake occurred in September 2007. However, the number of earthquakes did not increase as rapidly as it did during the second "great" earthquake during that time.
After understanding the pattern behind the increase in the time period of 2004-2007, a further exploration of the data will conducted to find a correlation between magnitude and depth of the earthquake. The following scatter plot will show the correlation between magnitude and depth regarding the occurred earthquakes.
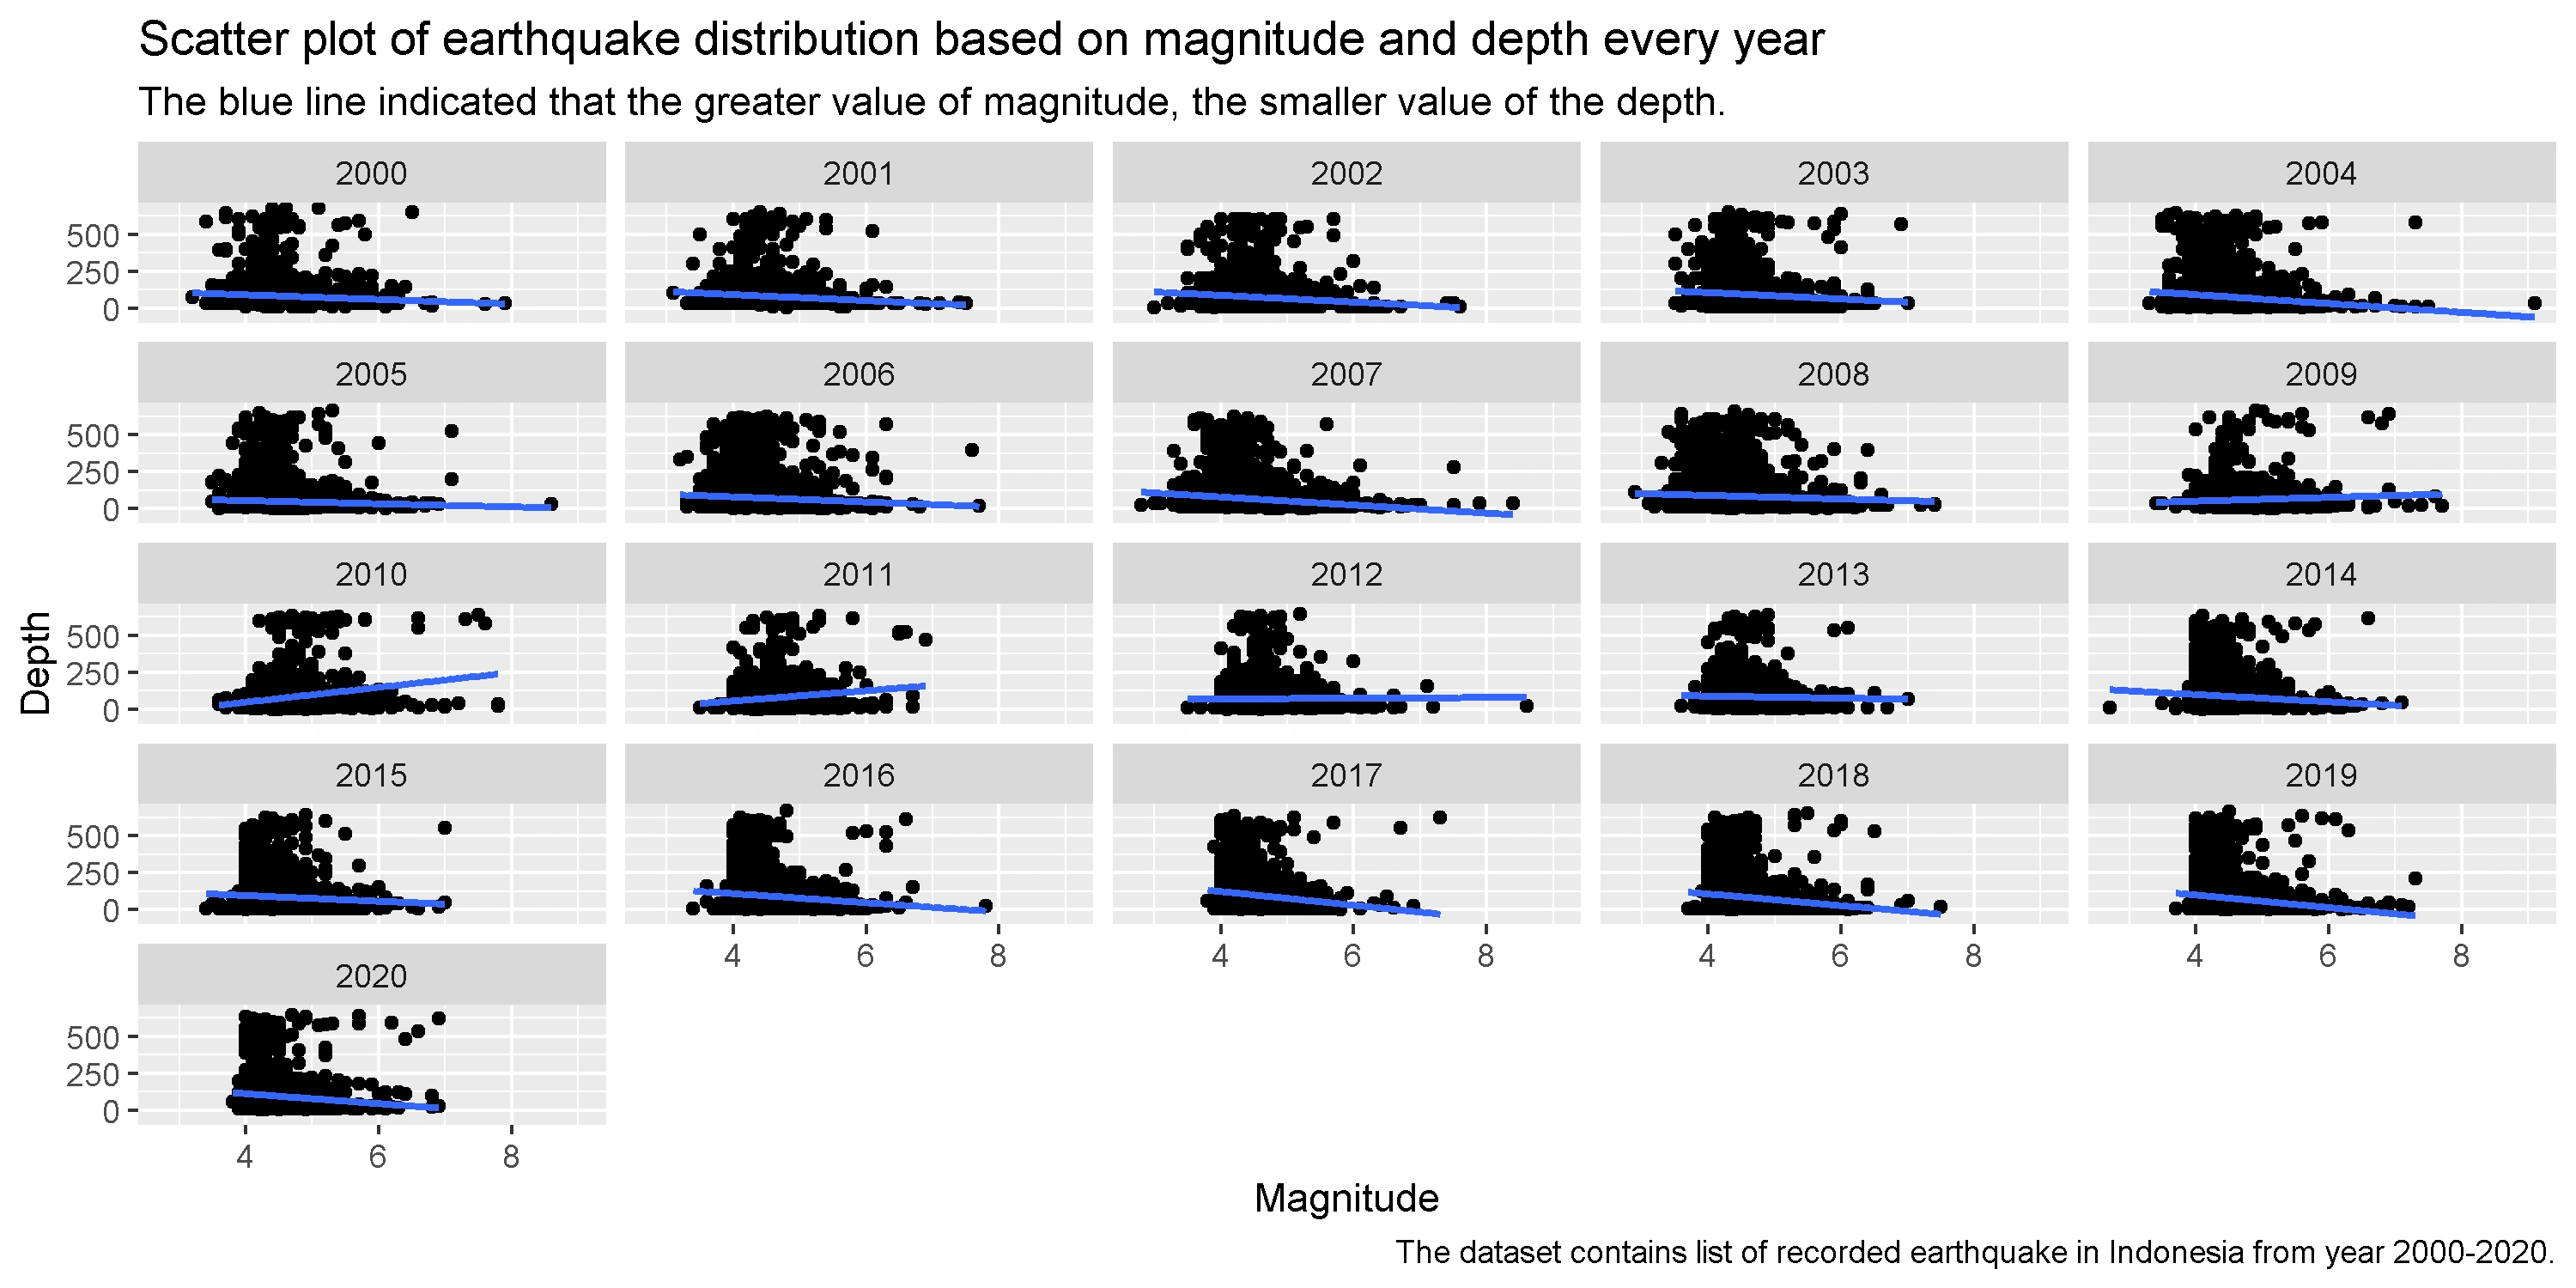
Fig. 6 Scatter plot of earthquakes distribution by magnitude and depth per year
The relationship between the magnitude and depth is inverse, as proven by the scatter plots above from Fig. 6. It means that, as the magnitude increases, the depth decreases. The larger the magnitude of the earthquake, it is most likely to have occurred at a shallower depth. This seems to be true because the previous "great" earthquake happened at a depth of less than 50 kilometers beneath the earth's surface.
Conclusion
From 2000 to 2020, there were 4245 "minor" earthquakes, 38092 "light" earthquakes, and 4163 "moderate" earthquakes in the Indonesian territory. Despite this, the most notable earthquakes were the "major" and the "great" earthquakes with the "major" occured 52 times and the"great" occured 4 times.
Every year, more than 1000 earthquakes with varying magnitudes occur in Indonesia, ranging from "minor" to "great" earthquakes.
The large number of earthquakes that occurred in 2005 were caused by which is considered as an "aftershock" from the previous year's "great" earthquakes in December 2004 and March 2005. Because of the two great earthquakes, the number of earthquakes in 2005 has increased by a double, from the year before it, especially for the lesser earthquakes.
The greater the magnitude of an earthquake based on the Richter scale, the shallower seems the depth.
References
[1] Adagunodo, A., et all. (2017) Evaluation of 0 < M < 8 earthquake data sets in African–Asian region during 1966–2015. Data in Brief.
[2] S. A. Greenhalgh and R. T. Parham, The Richter earthquake magnitude scale in South Australia (2007), Australian Journal of Earth Science.
[3] Pribadi, K., et all. (2021) Learning from past earthquake disasters: The need for knowledge management system to enhance infrastructure resilience in Indonesia. International Journal of Disaster Risk Reduction.
[4] Senduk, R., Indwiarti, Nhita, F. (2019) Clustering of Earthquake Prone Areas in Indonesia Using K-Medoids Algorithm. Indonesia Journal on Computing.


