
AI-Assisted Sales Intelligence Dashboard
Project Overview
This project is an end-to-end Sales Analytics solution built using Python, SQL, and Power BI.
The workflow includes:
Data Cleaning using Python (Pandas)
Data Storage using SQLite
Business Analysis using SQL Queries
Interactive Dashboard using Power BI
Automated Business Report Generation using Python
The goal of this project is to analyze sales performance, identify profitable products, monitor regional performance, and generate business recommendations.
Dataset
Dataset: Sample Superstore Dataset
Records: 9,994
Features:
Order Details
Customer Information
Product Information
Sales
Profit
Discount
Region
Category
Sub-Category
Tools & Technologies
Python
Pandas
SQLite
SQL
Power BI
Data Visualization
Business Intelligence
Project Workflow
CSV Dataset
↓
Data Cleaning (Python)
↓
SQLite Database
↓
SQL Analysis
↓
Power BI Dashboard
↓
AI Business Report
Dashboard Pages
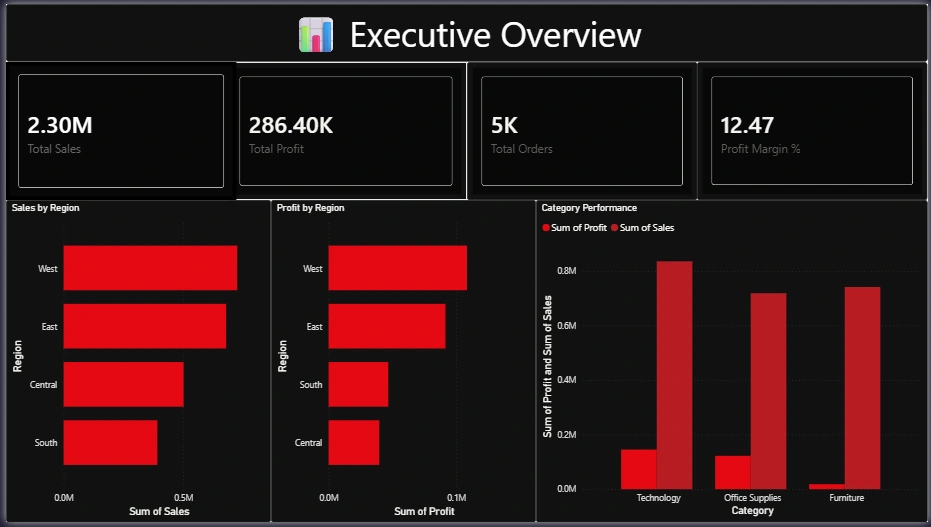
Executive Overview Total Sales Total Profit Total Orders Profit Margin Regional Sales Analysis Category Performance Analysis
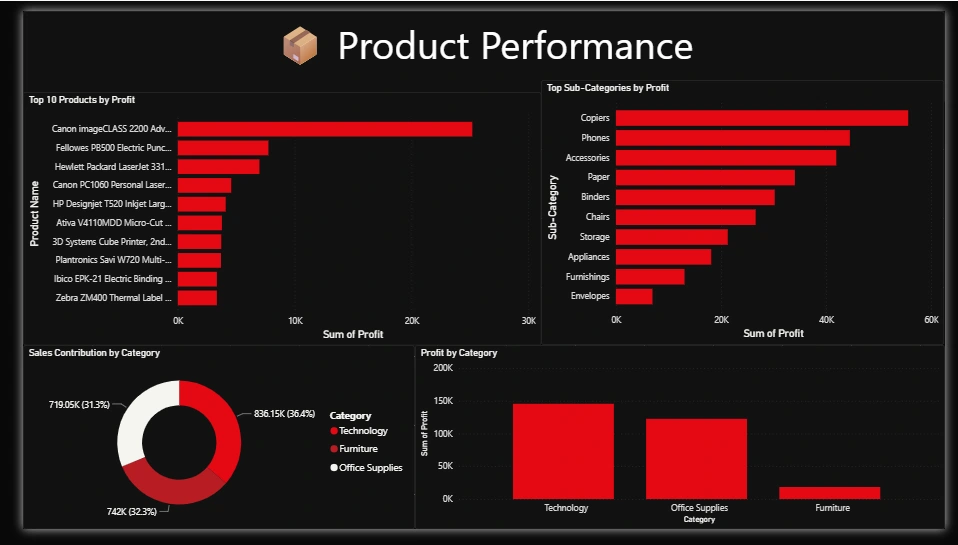
Product Performance Analysis Top Profitable Products Loss-Making Products Profit by Category Sales by Sub-Category
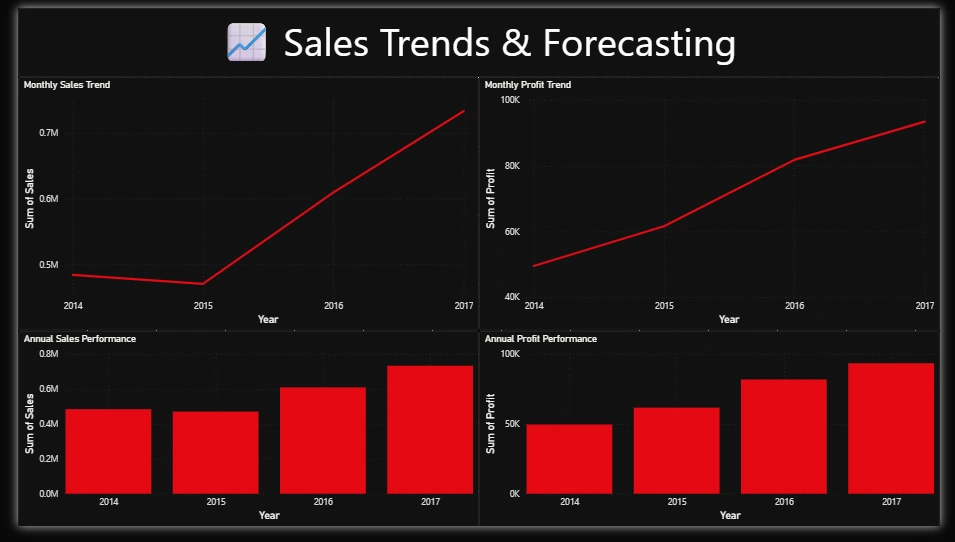
Sales Trends Analysis Sales Trends Over Time Profit Trends Seasonal Performance Insights Key Business Insights West Region generated the highest sales. Technology is the most profitable category. Several products generate significant losses and require pricing review. Sales performance varies significantly across regions. Automated AI Report The project includes a Python-based reporting system that automatically generates:
Total Sales
Total Profit
Business Insights
Strategic Recommendations
Author
Gourav Jangid
Aspiring Data Analyst
Open to Data Analytics Opportunities
0 likes · 0 views · Sep 19, 2026
AI-Assisted Sales Intelligence Dashboard Project Overview This project is an end-to-end Sales Analytics solution built using Python, SQL, and Power BI. The w...


