
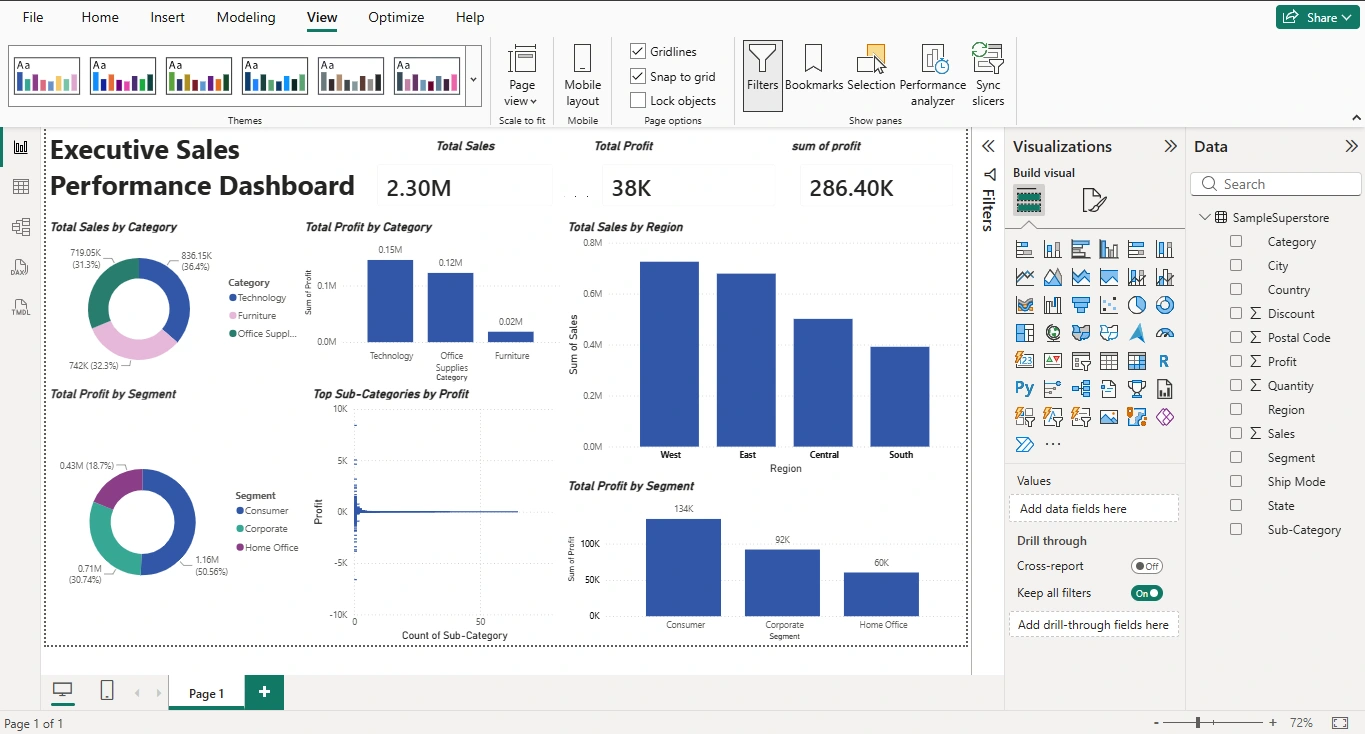
This project is an interactive Power BI dashboard developed to analyze sales performance, profitability, customer segments, and regional trends.
Key Metrics
Total Sales: $2.30M
Total Profit: $286.40K
Total Quantity Sold: 38K+
Key Insights
West region generated the highest sales and profit.
Consumer segment contributed the highest revenue and profit.
Technology category showed strong business performance.
Tools Used
Power BI
Data Visualization
Business Analytics
KPI Reporting
Skills Demonstrated
Dashboard Design
Data Storytelling
Business Intelligence
KPI Analysis
Data Analytics
0 likes · 0 views · Sep 6, 2026
This project is an interactive Power BI dashboard developed to analyze sales performance, profitability, customer segments, and regional trends. Key Metrics ...

