Gourav Jangid
Data Analyst | Power BI, Excel, SQL & Python
- 7
- Followers


I’ve been working on something for the past few weeks, and it’s finally live.
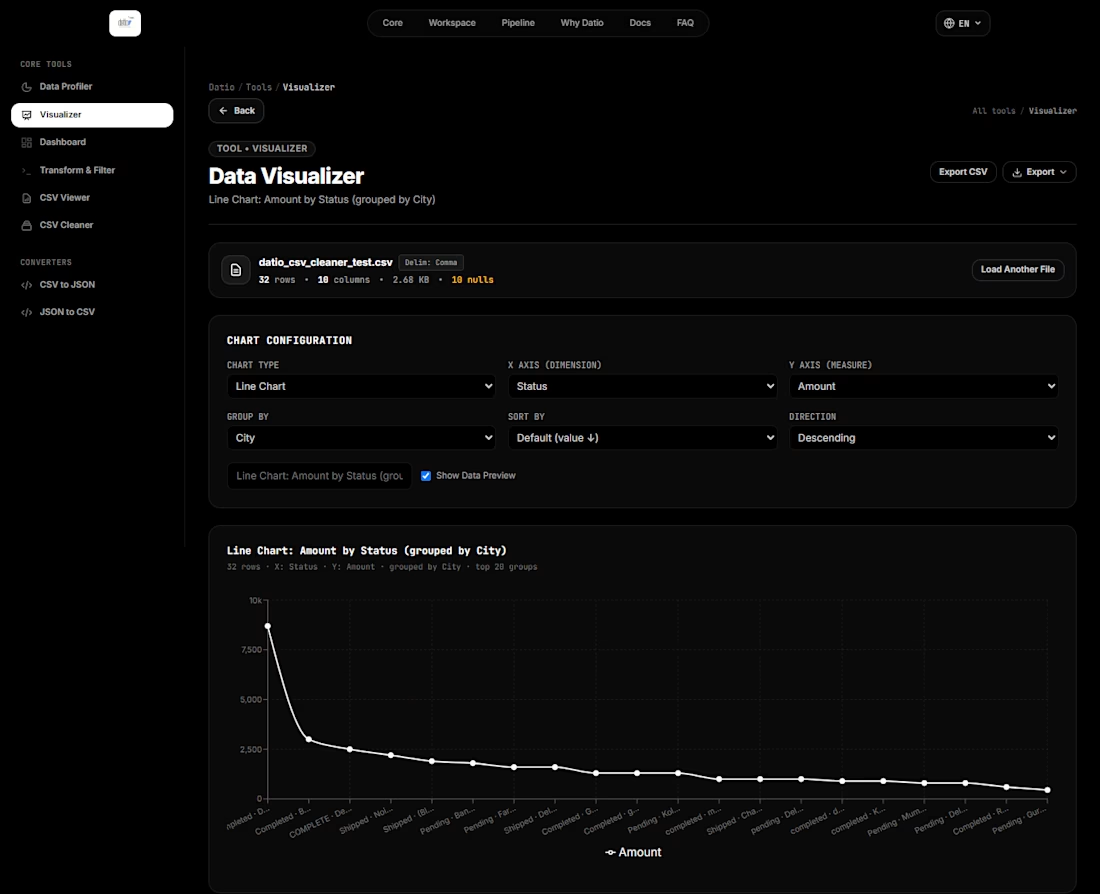
Introducing Datio — a browser-based data workspace built to make everyday data work simpler, faster, and more accessible.
🌐 https://datiotools.com/
(https://datiotools.com/)Instead of jumping between different tools for different tasks, Datio brings essential data workflows together in one place.
You can use it to:
📂 Explore CSV & JSON files
🧹 Clean and prepare messy datasets
🔍 Profile datasets and identify missing values, duplicates, outliers & data-quality issues
⚙️ Filter, transform and manage data
📊 Analyze data through interactive visualizations
📈 Build KPI dashboards from your datasets
🔄 Convert CSV ↔ JSON
⬇️ Export your processed data
The idea behind Datio was straightforward:
Take the repetitive parts of working with data and put them into one simple workspace.
I didn’t want to build another website that just demonstrates a concept. I wanted to build something people can actually open, use, and get work done with.
After weeks of planning, development, testing, debugging, and refinement, Datio is now live on the internet and ready to use.
🔗 Try Datio: https://datiotools.com/
(https://datiotools.com/)This is the first public version — and there’s a lot more I want to build from here.
#Datio (https://www.linkedin.com/search/results/all/?keywords=%23datio&origin=HASH_TAG_FROM_FEED) #DataAnalytics (https://www.linkedin.com/search/results/all/?keywords=%23dataanalytics&origin=HASH_TAG_FROM_FEED) #DataTools (https://www.linkedin.com/search/results/all/?keywords=%23datatools&origin=HASH_TAG_FROM_FEED) #DataCleaning (https://www.linkedin.com/search/results/all/?keywords=%23datacleaning&origin=HASH_TAG_FROM_FEED) #DataAnalysis (https://www.linkedin.com/search/results/all/?keywords=%23dataanalysis&origin=HASH_TAG_FROM_FEED) #DataVisualization (https://www.linkedin.com/search/results/all/?keywords=%23datavisualization&origin=HASH_TAG_FROM_FEED) #DataScience (https://www.linkedin.com/search/results/all/?keywords=%23datascience&origin=HASH_TAG_FROM_FEED) #CSV (https://www.linkedin.com/search/results/all/?keywords=%23csv&origin=HASH_TAG_FROM_FEED) #JSON (https://www.linkedin.com/search/results/all/?keywords=%23json&origin=HASH_TAG_FROM_FEED) #Dashboard (https://www.linkedin.com/search/results/all/?keywords=%23dashboard&origin=HASH_TAG_FROM_FEED) #WebDevelopment (https://www.linkedin.com/search/results/all/?keywords=%23webdevelopment&origin=HASH_TAG_FROM_FEED) #BuildInPublic (https://www.linkedin.com/search/results/all/?keywords=%23buildinpublic&origin=HASH_TAG_FROM_FEED)
2
163
AI-Assisted Sales Intelligence Dashboard
Project Overview
This project is an end-to-end Sales Analytics solution built using Python, SQL, and Power BI.
The workflow includes:
Data Cleaning using Python (Pandas)
Data Storage using SQLite
Business Analysis using SQL Queries
Interactive Dashboard using Power BI
Automated Business Report Generation using Python
The goal of this project is to analyze sales performance, identify profitable products, monitor regional performance, and generate business recommendations.
Dataset
Dataset: Sample Superstore Dataset
Records: 9,994
Features:
Order Details
Customer Information
Product Information
Sales
Profit
Discount
Region
Category
Sub-Category
Tools & Technologies
Python
Pandas
SQLite
SQL
Power BI
Data Visualization
Business Intelligence
Project Workflow
CSV Dataset
↓
Data Cleaning (Python)
↓
SQLite Database
↓
SQL Analysis
↓
Power BI Dashboard
↓
AI Business Report
Dashboard Pages
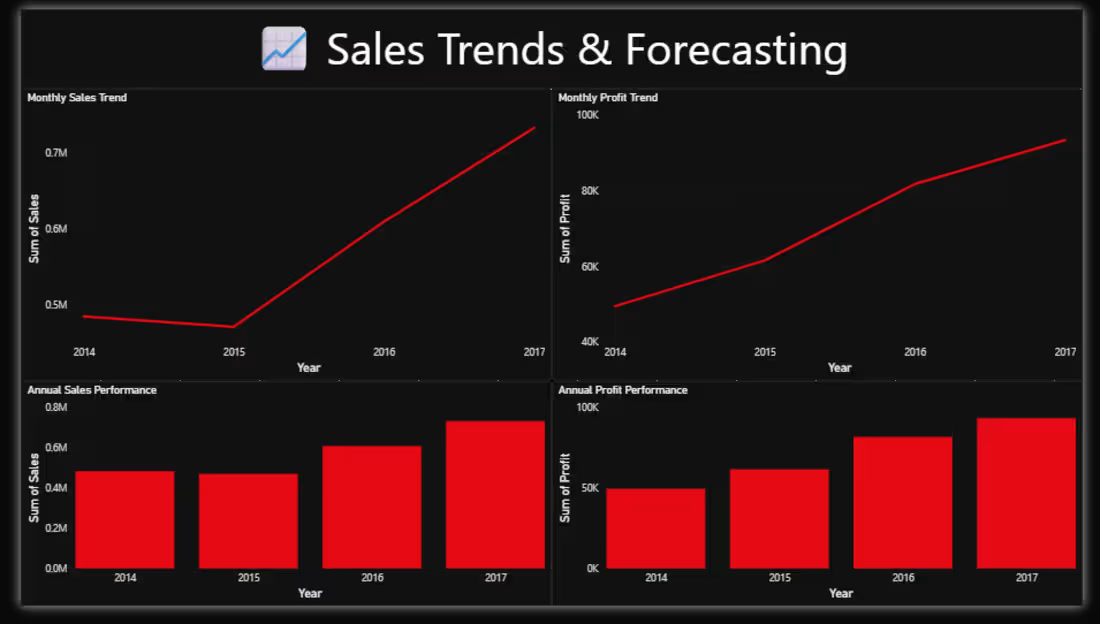
Executive Overview Total Sales Total Profit Total Orders Profit Margin Regional Sales Analysis Category Performance Analysis
Product Performance Analysis Top Profitable Products Loss-Making Products Profit by Category Sales by Sub-Category
Sales Trends Analysis Sales Trends Over Time Profit Trends Seasonal Performance Insights Key Business Insights West Region generated the highest sales. Technology is the most profitable category. Several products generate significant losses and require pricing review. Sales performance varies significantly across regions. Automated AI Report The project includes a Python-based reporting system that automatically generates:
Total Sales
Total Profit
Business Insights
Strategic Recommendations
Author
Gourav Jangid
Aspiring Data Analyst
Open to Data Analytics Opportunities
4
719
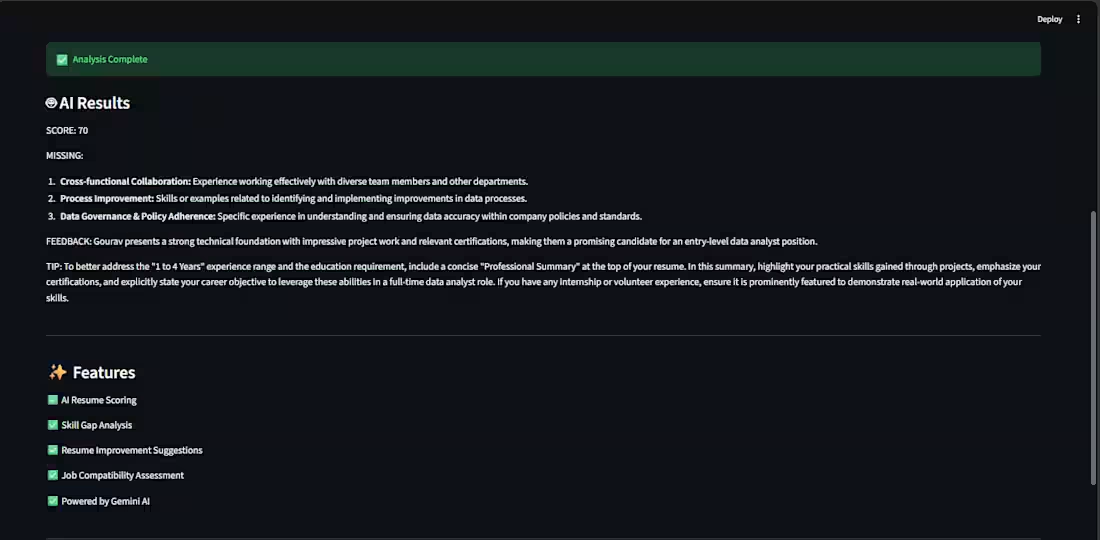
Finding the right job often requires manually comparing a resume against dozens of job descriptions.
This project automates that process by:
Analyzing a resume against multiple real job postings
Generating AI-powered match scores
Identifying missing skills
Providing resume improvement suggestions
Storing results in a SQL database
Visualizing insights in Power BI
Offering a live Streamlit web application
🛠️ Tech Stack
Python
Pandas
SQLite
SQL
Google Gemini AI API
Streamlit
Power BI
VS Code
📊 Key Features
AI Resume Analysis
Resume-to-job match scoring (0–100%)
Missing skill identification
AI-generated recruiter feedback
Resume improvement recommendations
Database & SQL
Stores analyzed jobs in SQLite
Performs analytical queries
Identifies skill gaps
Finds best-fit companies and locations
Power BI Dashboard
Average Match Score
Strong Fit Jobs
Top Match Score
Company Match Analysis
Skill Gap Analysis
Streamlit Application
Paste any job description and instantly receive:
Match Score
Missing Skills
AI Feedback
Resume Improvement Tips
📈 Dashboard Insights
The dashboard provides:
Overall resume strength across jobs
Best matching companies
Skill gap analysis
Job fit distribution
Career improvement opportunities
🎯 Business Value
This project demonstrates:
Data Cleaning
Data Analysis
SQL Querying
AI Integration
Dashboard Development
Data Visualization
End-to-End Analytics Workflow
🔮 Future Improvements
Analyze 100+ job postings
Automated LinkedIn job ingestion
Multiple resume comparison
Industry-specific recommendations
Advanced skill trend tracking
👨💻 Author
Gourav Jangid
Aspiring Data Analyst passionate about transforming data into actionable insights using Analytics, SQL, Python, Power BI, and AI.
1
4
520
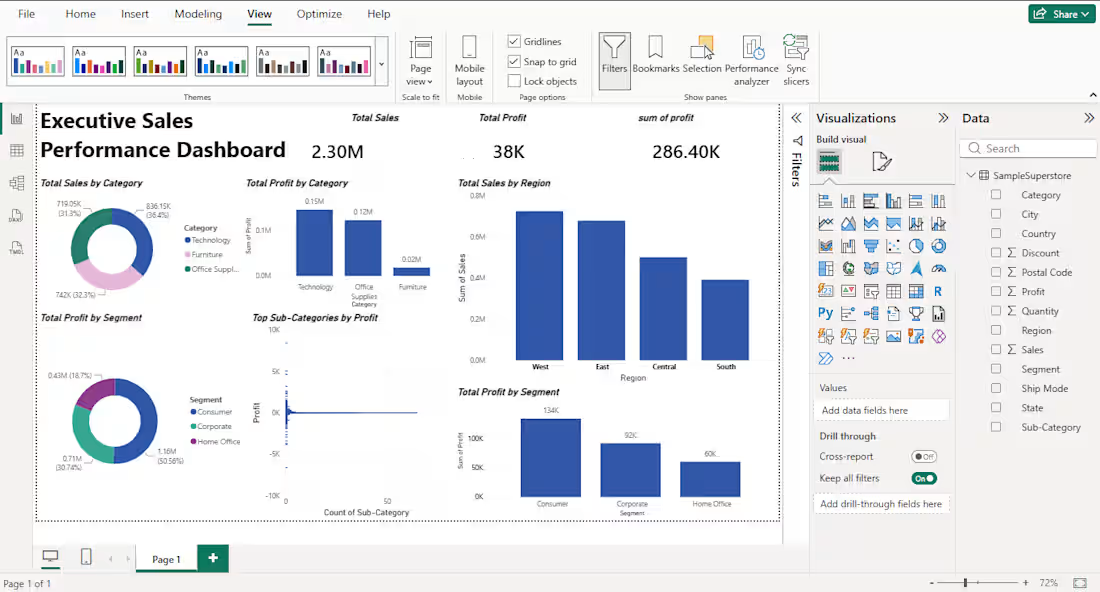
This project is an interactive Power BI dashboard developed to analyze sales performance, profitability, customer segments, and regional trends.
Key Metrics
Total Sales: $2.30M
Total Profit: $286.40K
Total Quantity Sold: 38K+
Key Insights
West region generated the highest sales and profit.
Consumer segment contributed the highest revenue and profit.
Technology category showed strong business performance.
Tools Used
Power BI
Data Visualization
Business Analytics
KPI Reporting
Skills Demonstrated
Dashboard Design
Data Storytelling
Business Intelligence
KPI Analysis
Data Analytics
2
221