Shopify Sales Analytics & Revenue

Balogun Abideen


Shopify Sales Analytics & Revenue Performance | E-commerce Dashboard
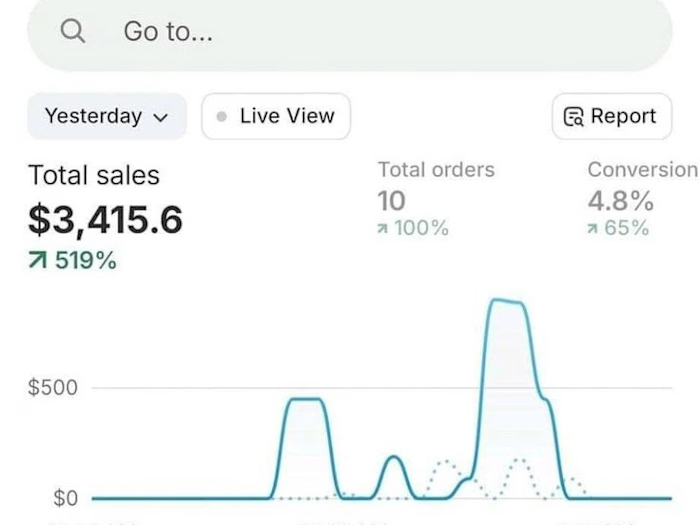
This Shopify analytics dashboard showcases store revenue trends and key sales performance data. The dashboard displays $44,635.05 in total sales and $41,715.00 in gross sales for the reporting period shown.
The sales performance graph provides a visual overview of revenue changes over time, helping store owners monitor sales trends and evaluate their store's financial performance. These insights can support better business decisions, sales planning, and ongoing e-commerce optimization.
Key Metrics Displayed:
Total Sales: $44,635.05
Gross Sales: $41,715.00
Sales trends over time
Revenue performance visualization
Sales breakdown reporting
E-commerce performance monitoring
Skills: Shopify Analytics, E-commerce Management, Sales Reporting, Revenue Tracking, Shopify Store Management.
Like this project
Posted Oct 15, 2026
Shopify Sales Analytics & Revenue Performance | E-commerce Dashboard This Shopify analytics dashboard showcases store revenue trends and key sales performanc...