Shopify Sales Growth & Analytics

Balogun Abideen


Shopify Sales Growth & Analytics | E-commerce Performance Dashboard
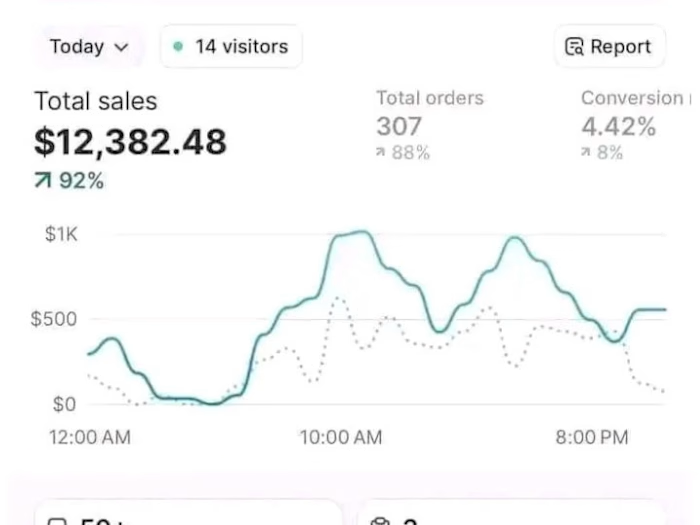
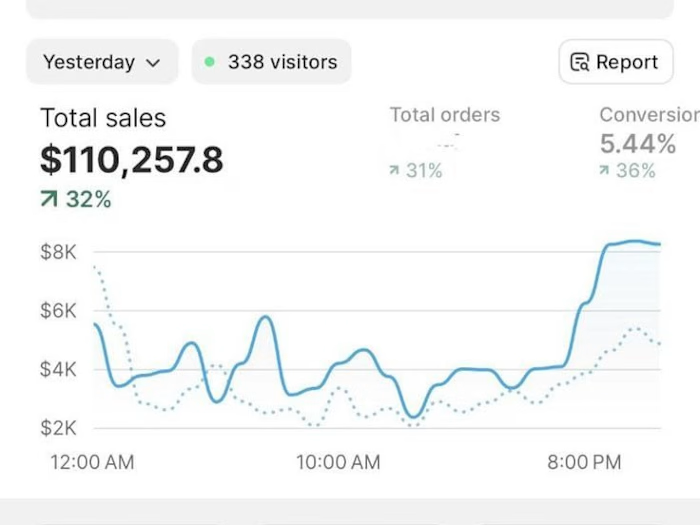
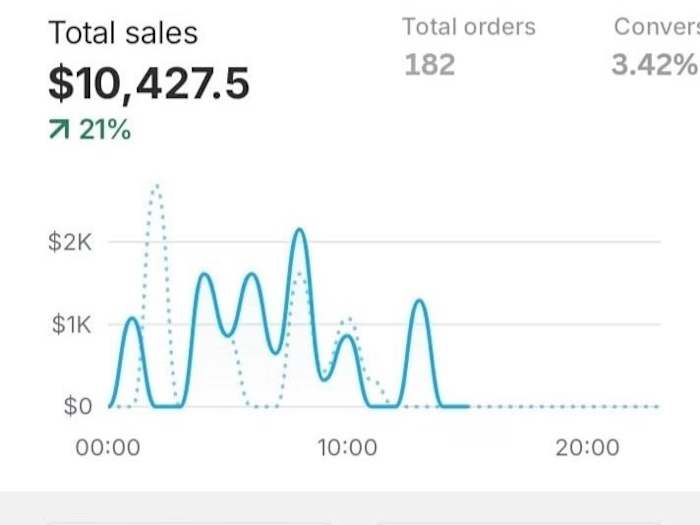
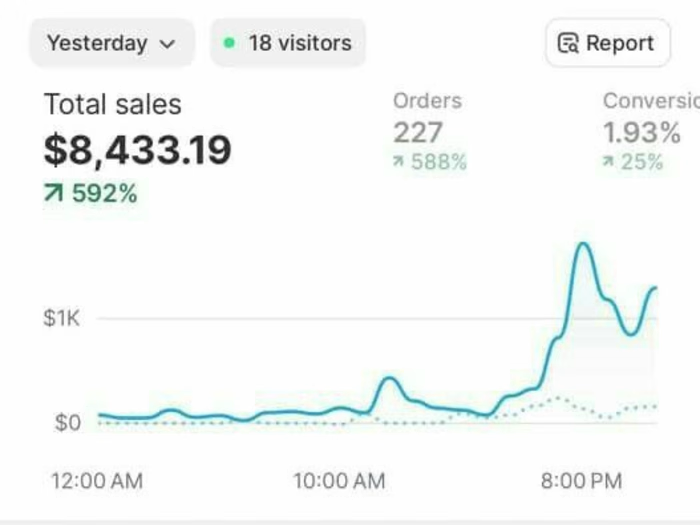
This Shopify analytics dashboard highlights important e-commerce performance metrics, including total sales, order volume, conversion rate, and sales trends. The screenshot displays $3,415.60 in total sales, 10 total orders, and a 4.8% conversion rate for the selected reporting period.
The dashboard provides an overview of store performance, helping business owners monitor sales activity, track order volume, and understand how effectively their store converts visitors into customers. The sales graph and performance indicators offer insights that can support data-driven decisions and ongoing store optimization.
Key Metrics Displayed:
Total Sales: $3,415.60
Total Orders: 10
Conversion Rate: 4.8%
Sales Growth: 519%
Orders Growth: 100%
Conversion Rate Growth: 65%
Sales performance graph
Order fulfillment overview showing 27 orders to fulfill
Skills: Shopify Analytics, E-commerce Management, Sales Reporting, Conversion Rate Analysis, Shopify Store Management.
Like this project
Posted Oct 15, 2026
Shopify Sales Growth & Analytics | E-commerce Performance Dashboard This Shopify analytics dashboard highlights important e-commerce performance metrics, inc...