One Page Financial proposal
Scott DS Young
Overview
This project began with the client sending over several Excel spreadsheets—full of good information but trapped in the world’s least flattering format. The goal was to translate everything into a clean, one-page visual summary that stakeholders could read quickly without squinting or scrolling through tabs.
Challenges & Approach
The original charts were busy and ranged across multiple sheets. I needed to consolidate everything:
Simplify each graph down to 6–8 bars, clearly present six main development options, and create a layout where the story of the data flows without confusion. I started by reviewing the “before” visuals, mapping out what information truly mattered, and designing a dashboard-inspired layout that put clarity first.
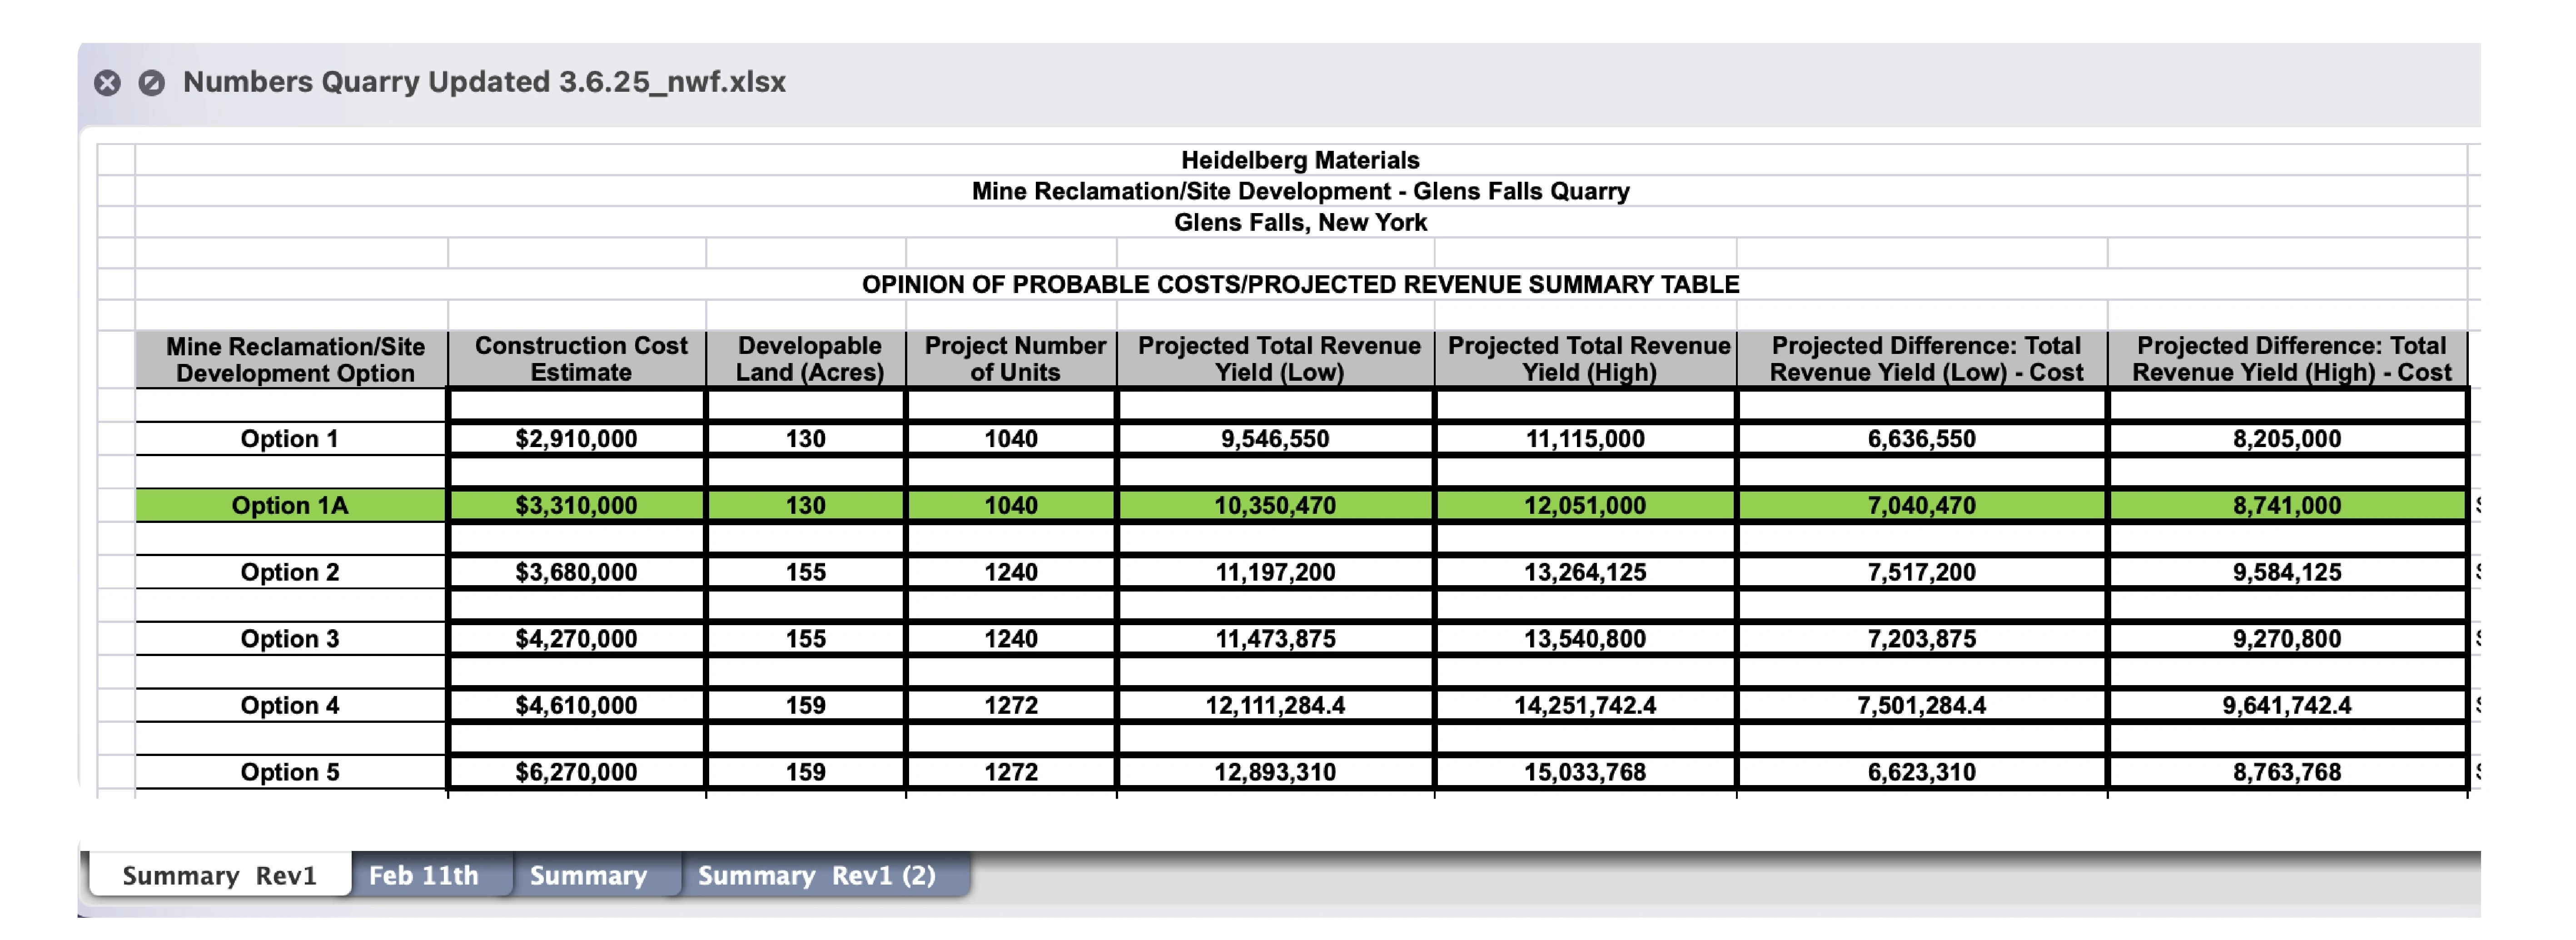
BEFORE
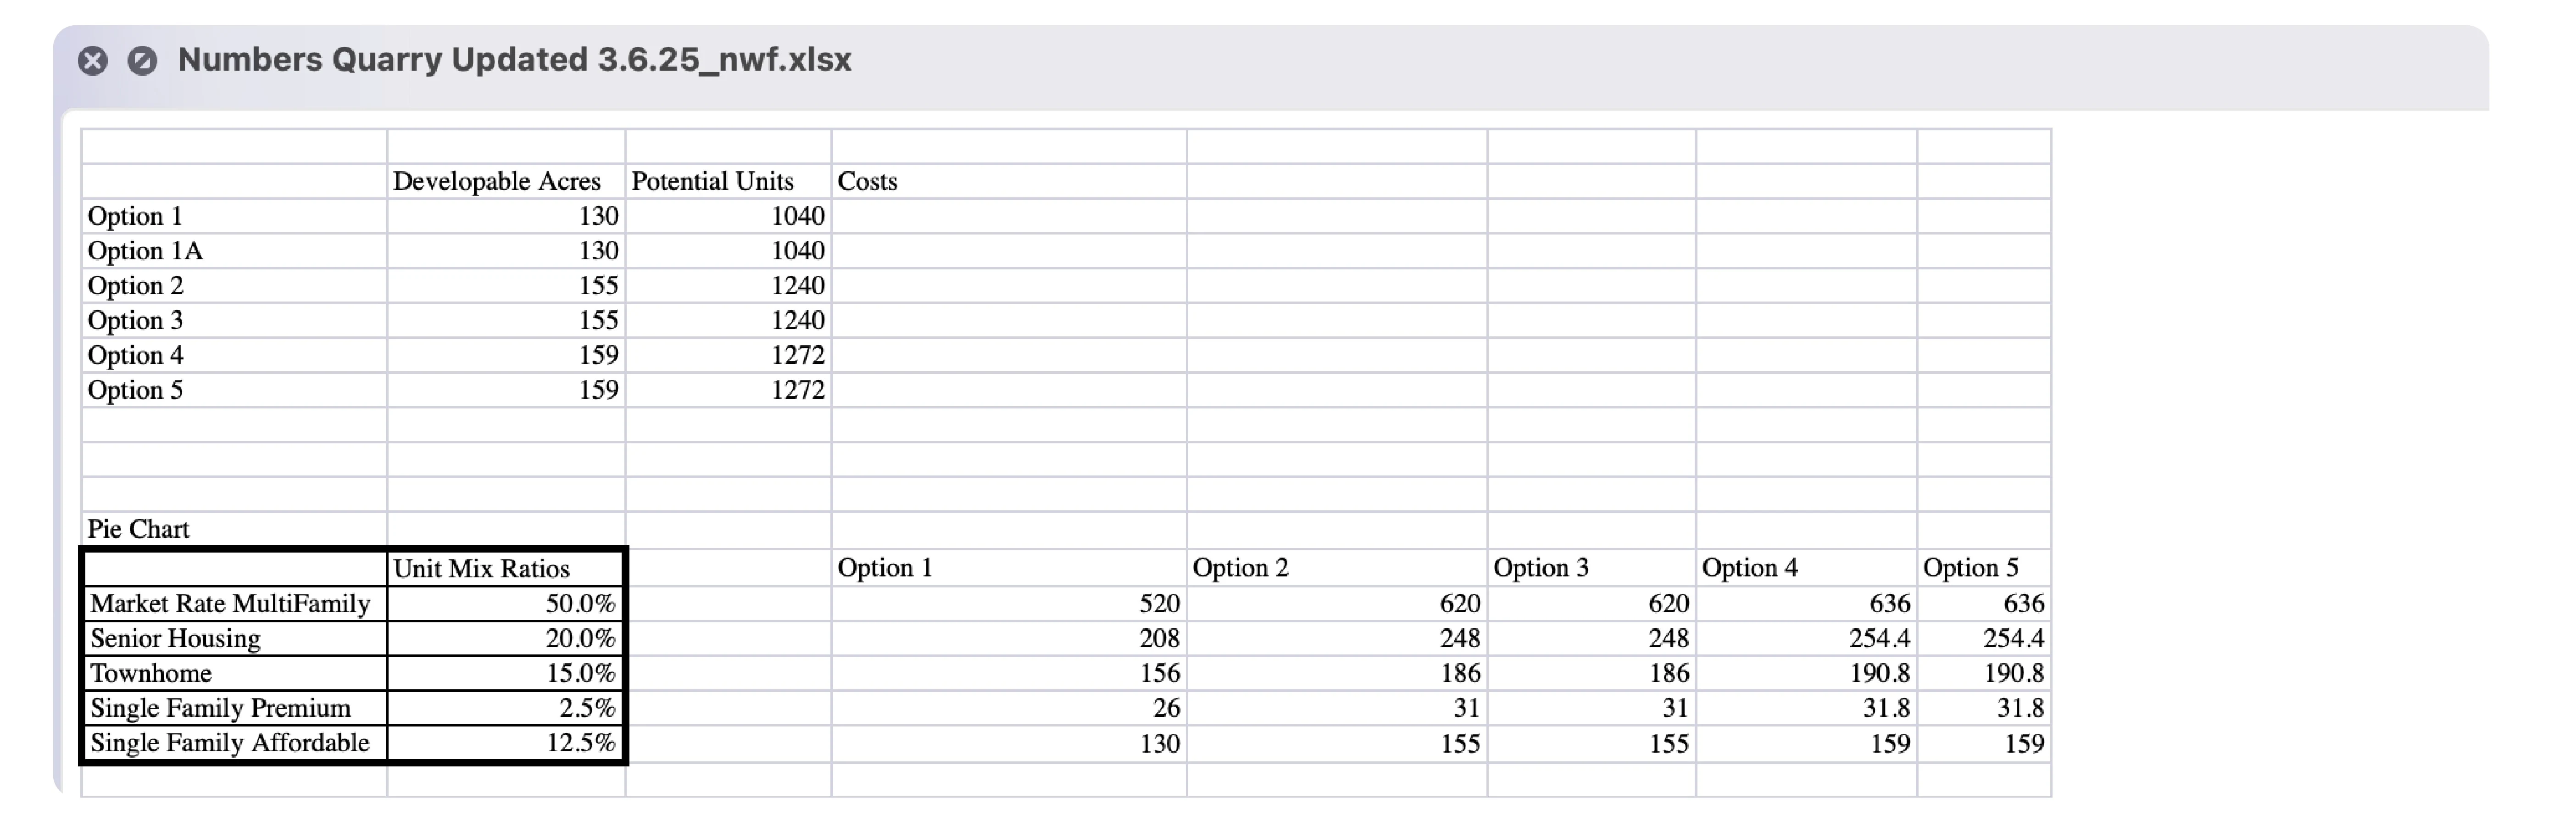
BEFORE
Setup the style sheet

Solutions
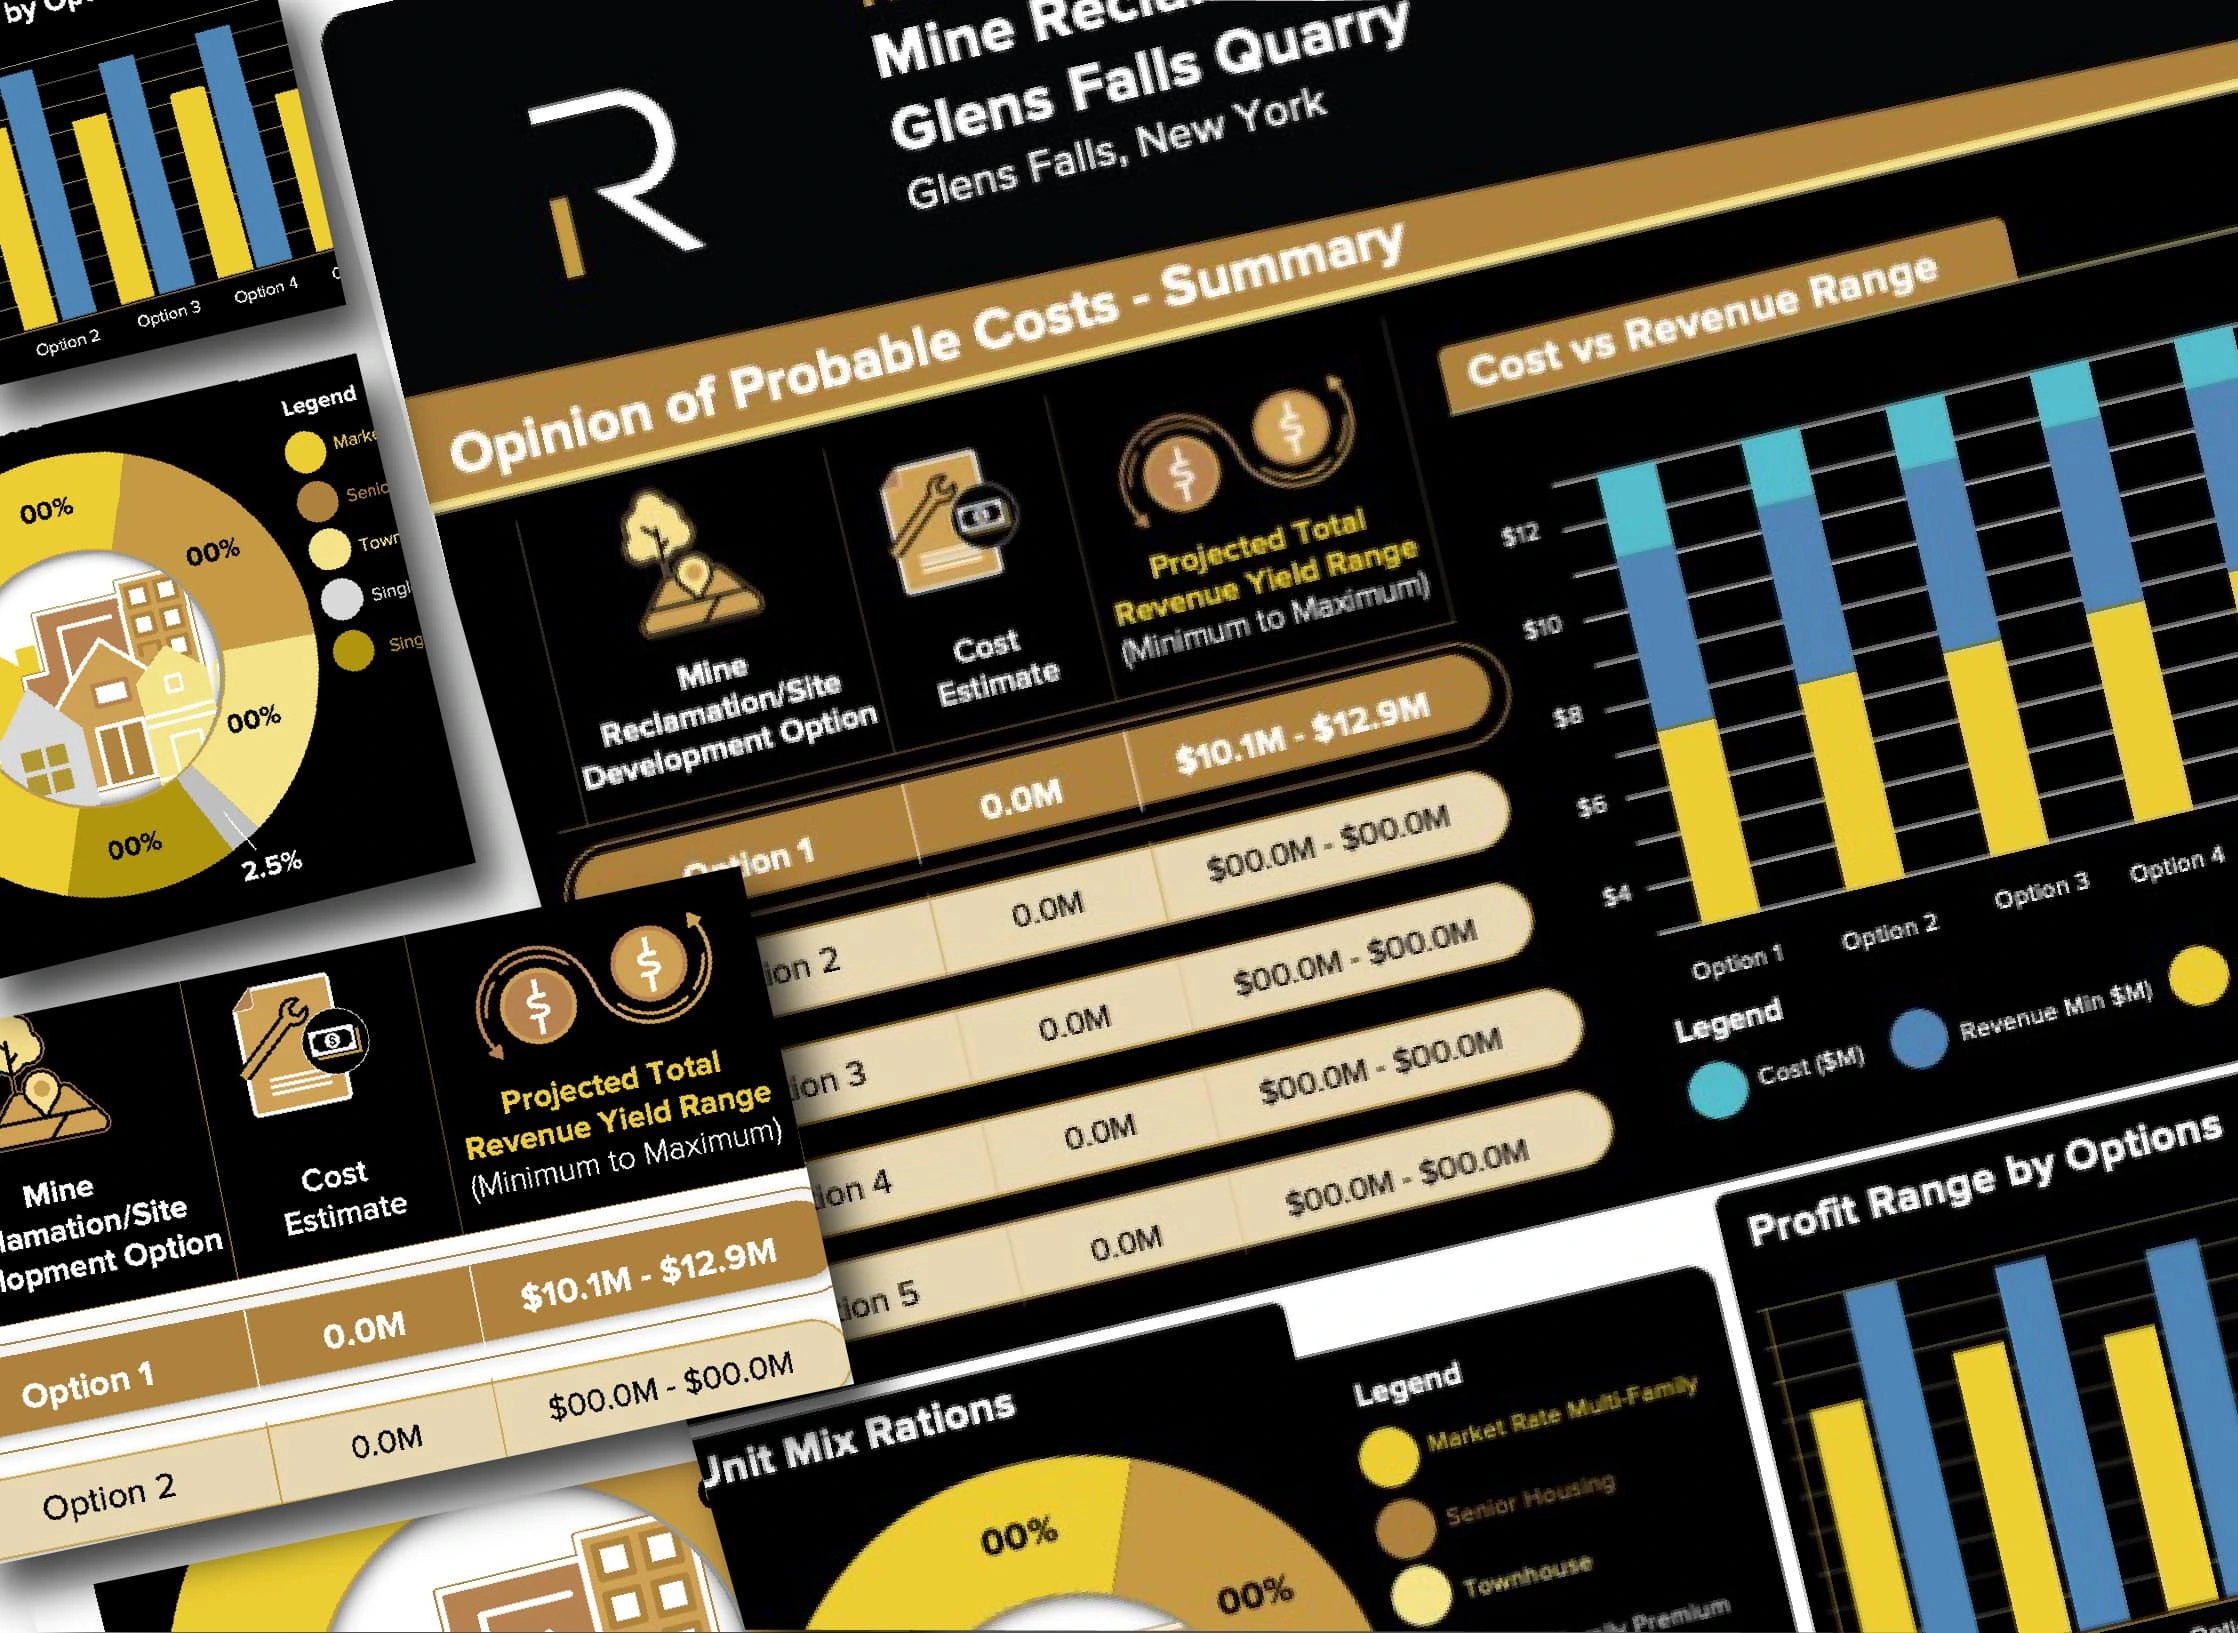
I refined the charts, introduced custom iconography for the key sections, and built a structure that made the piece read more like a visual report than an exported spreadsheet. The design balances hierarchy, color, and spacing so the numbers are easy to understand—even on a single page.
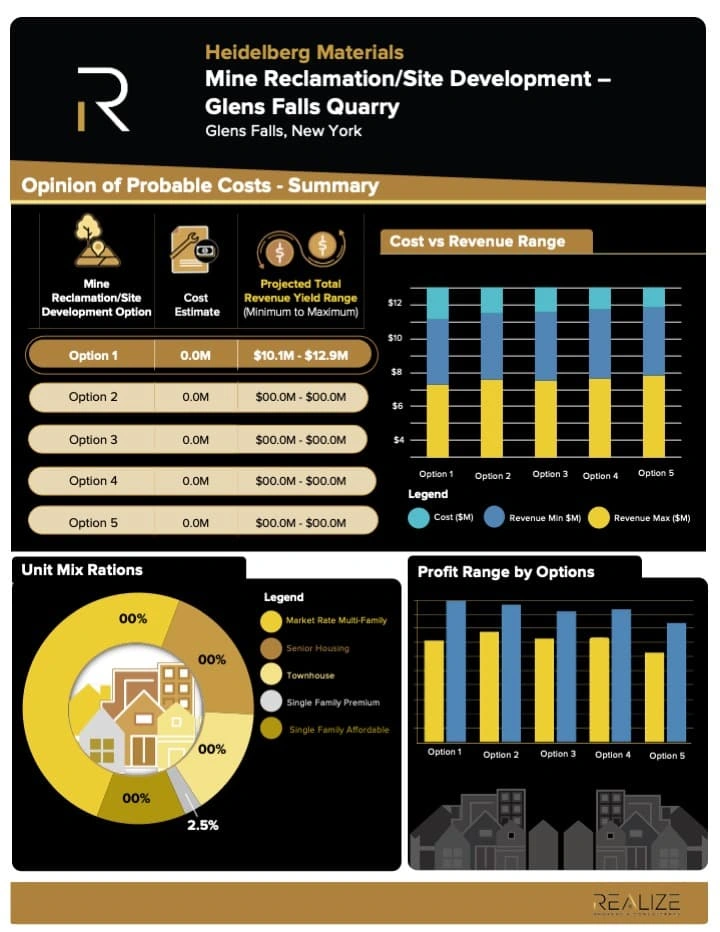
DELIVERABLE
Outcome
The client received a polished, editable one-pager that highlights their data clearly and professionally. They can now update their Excel sheets and instantly apply the design system without breaking anything. Think of it as an Excel glow-up… not something you see every day.
Like this project
Posted May 6, 2025
Redesigned complex Excel spreadsheets into a clean, editable one-page report with streamlined charts and a modern, dashboard feel.”
Likes
0
Views
18
Timeline
May 9, 2025 - May 13, 2025