OList Store BI Analysis
Abhinav Dubey
OList Store BI Analysis
📌 Overview
This project analyses the Brazilian e-commerce dataset 'OList', providing key business insights into sales performance, customer behaviour, product performance, and seller logistics.
This project leverages Python and related libraries for data manipulation and Tableau for interactive dashboards.
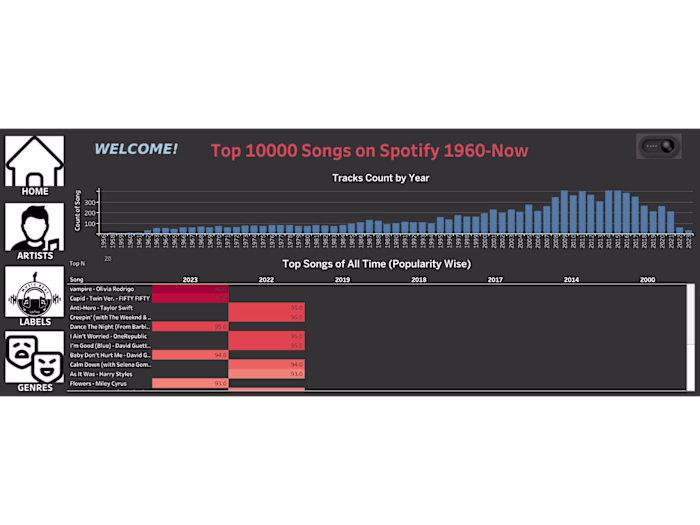
📊 Interactive Visualisations
The analysis is presented through an interactive Tableau dashboard, offering a dynamic exploration of key business metrics:
This dashboard enables stakeholders to explore:
Sales trends
Customer distribution
Shipping & logistics insights
Product performance
Key business KPIs
⚙️ Installation & Usage
This project is structured as a Jupyter Notebook, guiding users through data preparation, exploratory data analysis (EDA), and business insights.
Steps to Set Up the Project Locally
1️⃣ Clone the repository:
2️⃣ Create a Conda environment:
3️⃣ Activate the environment:
4️⃣ Launch Jupyter Lab:
5️⃣ Open the project notebook and begin analysis.
🔹 The required Python libraries are listed in
environment.yml.
🔹 Machine Learning (ML) operations using scikit-learn are included for certain analyses.
🔹 Dataset profile reports (generated using ydata_profiling) are available in the repository.
🔹 The dataset consists of 8 tables, which were merged and optimised for in-depth analysis using Python.
🔹 A custom function describex() is provided for more detailed descriptive statistics compared to pandas.describe().📁 Project Structure
📂 OList-Store-BI-Analysis/ │-- 📄 README (Project overview & setup instructions) │-- 📄 environment.yml (Conda environment dependencies) │-- 📜 BI Analysis (Olist).ipynb (Jupyter Notebook with analysis) │-- 📜 Dataset Profile Reports (HTML) (Auto-generated dataset insights)
🔍 Analysis Overview
📈 Sales Performance Analysis
Trends over time 📊
Performance by region 🏙️
Average Order Value (AOV) 💰
Seasonality
🎯 Customer Insights
Customer segmentation (RFM analysis)
Sentiment analysis on customer reviews
Customer Lifetime Value (CLTV) estimation
Geolocation analysis
🚛 Seller & Logistics Insights
Seller performance analysis
Shipping delays & logistics efficiency
Seller ratings & ML-based performance prediction
📢 Seller Marketing Insights
Seller lead conversion analysis
Seller classification using ML techniques
🛍️ Payment Methods Insights
Payment method distribution & profitability trends
🛍️ Product & Payment Insights
Most profitable products & categories
Product listing quality analysis
🔹 Key KPIs such as total sales, AOV, ratings, and delivery delays are highlighted in the Tableau dashboard for executive insights.
📂 Dataset Reference
This project utilises the OList Brazilian e-commerce dataset, available on Kaggle:
Datasets can be downloaded and explored using these links.
🙌 Acknowledgements
Special thanks to:
💡 ChatGPT – For assisting in structuring the analysis, refining documentation, and optimising project workflow.
📜 Licence
This project is open-source under the MIT Licence.
⚠️ The dataset usage is subject to the terms and conditions of the dataset provider.
🚀 Contributions & feedback are welcome!
Feel free to fork, modify, and enhance this project.
Like this project
Posted Apr 24, 2025
Analyzed OList e-commerce data for business insights using Python and Tableau.