Built with Framer
Flowmetrics – SaaS Analytics Web Design
Ivan Manriquez
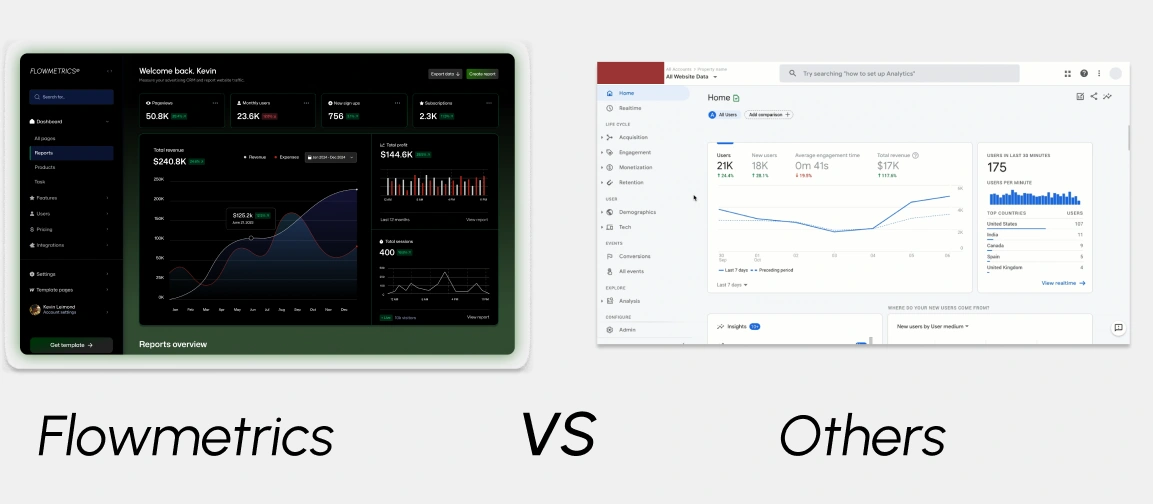
💡 Unlocking Operational Insight
Flowmetrics was created to solve a growing problem in scaling B2B teams: the lack of clarity in operational workflows. While many companies rely on project management tools, they often lack a bird’s-eye view of performance bottlenecks and inter-team dependencies.
🧭 The Mission Behind the Metrics
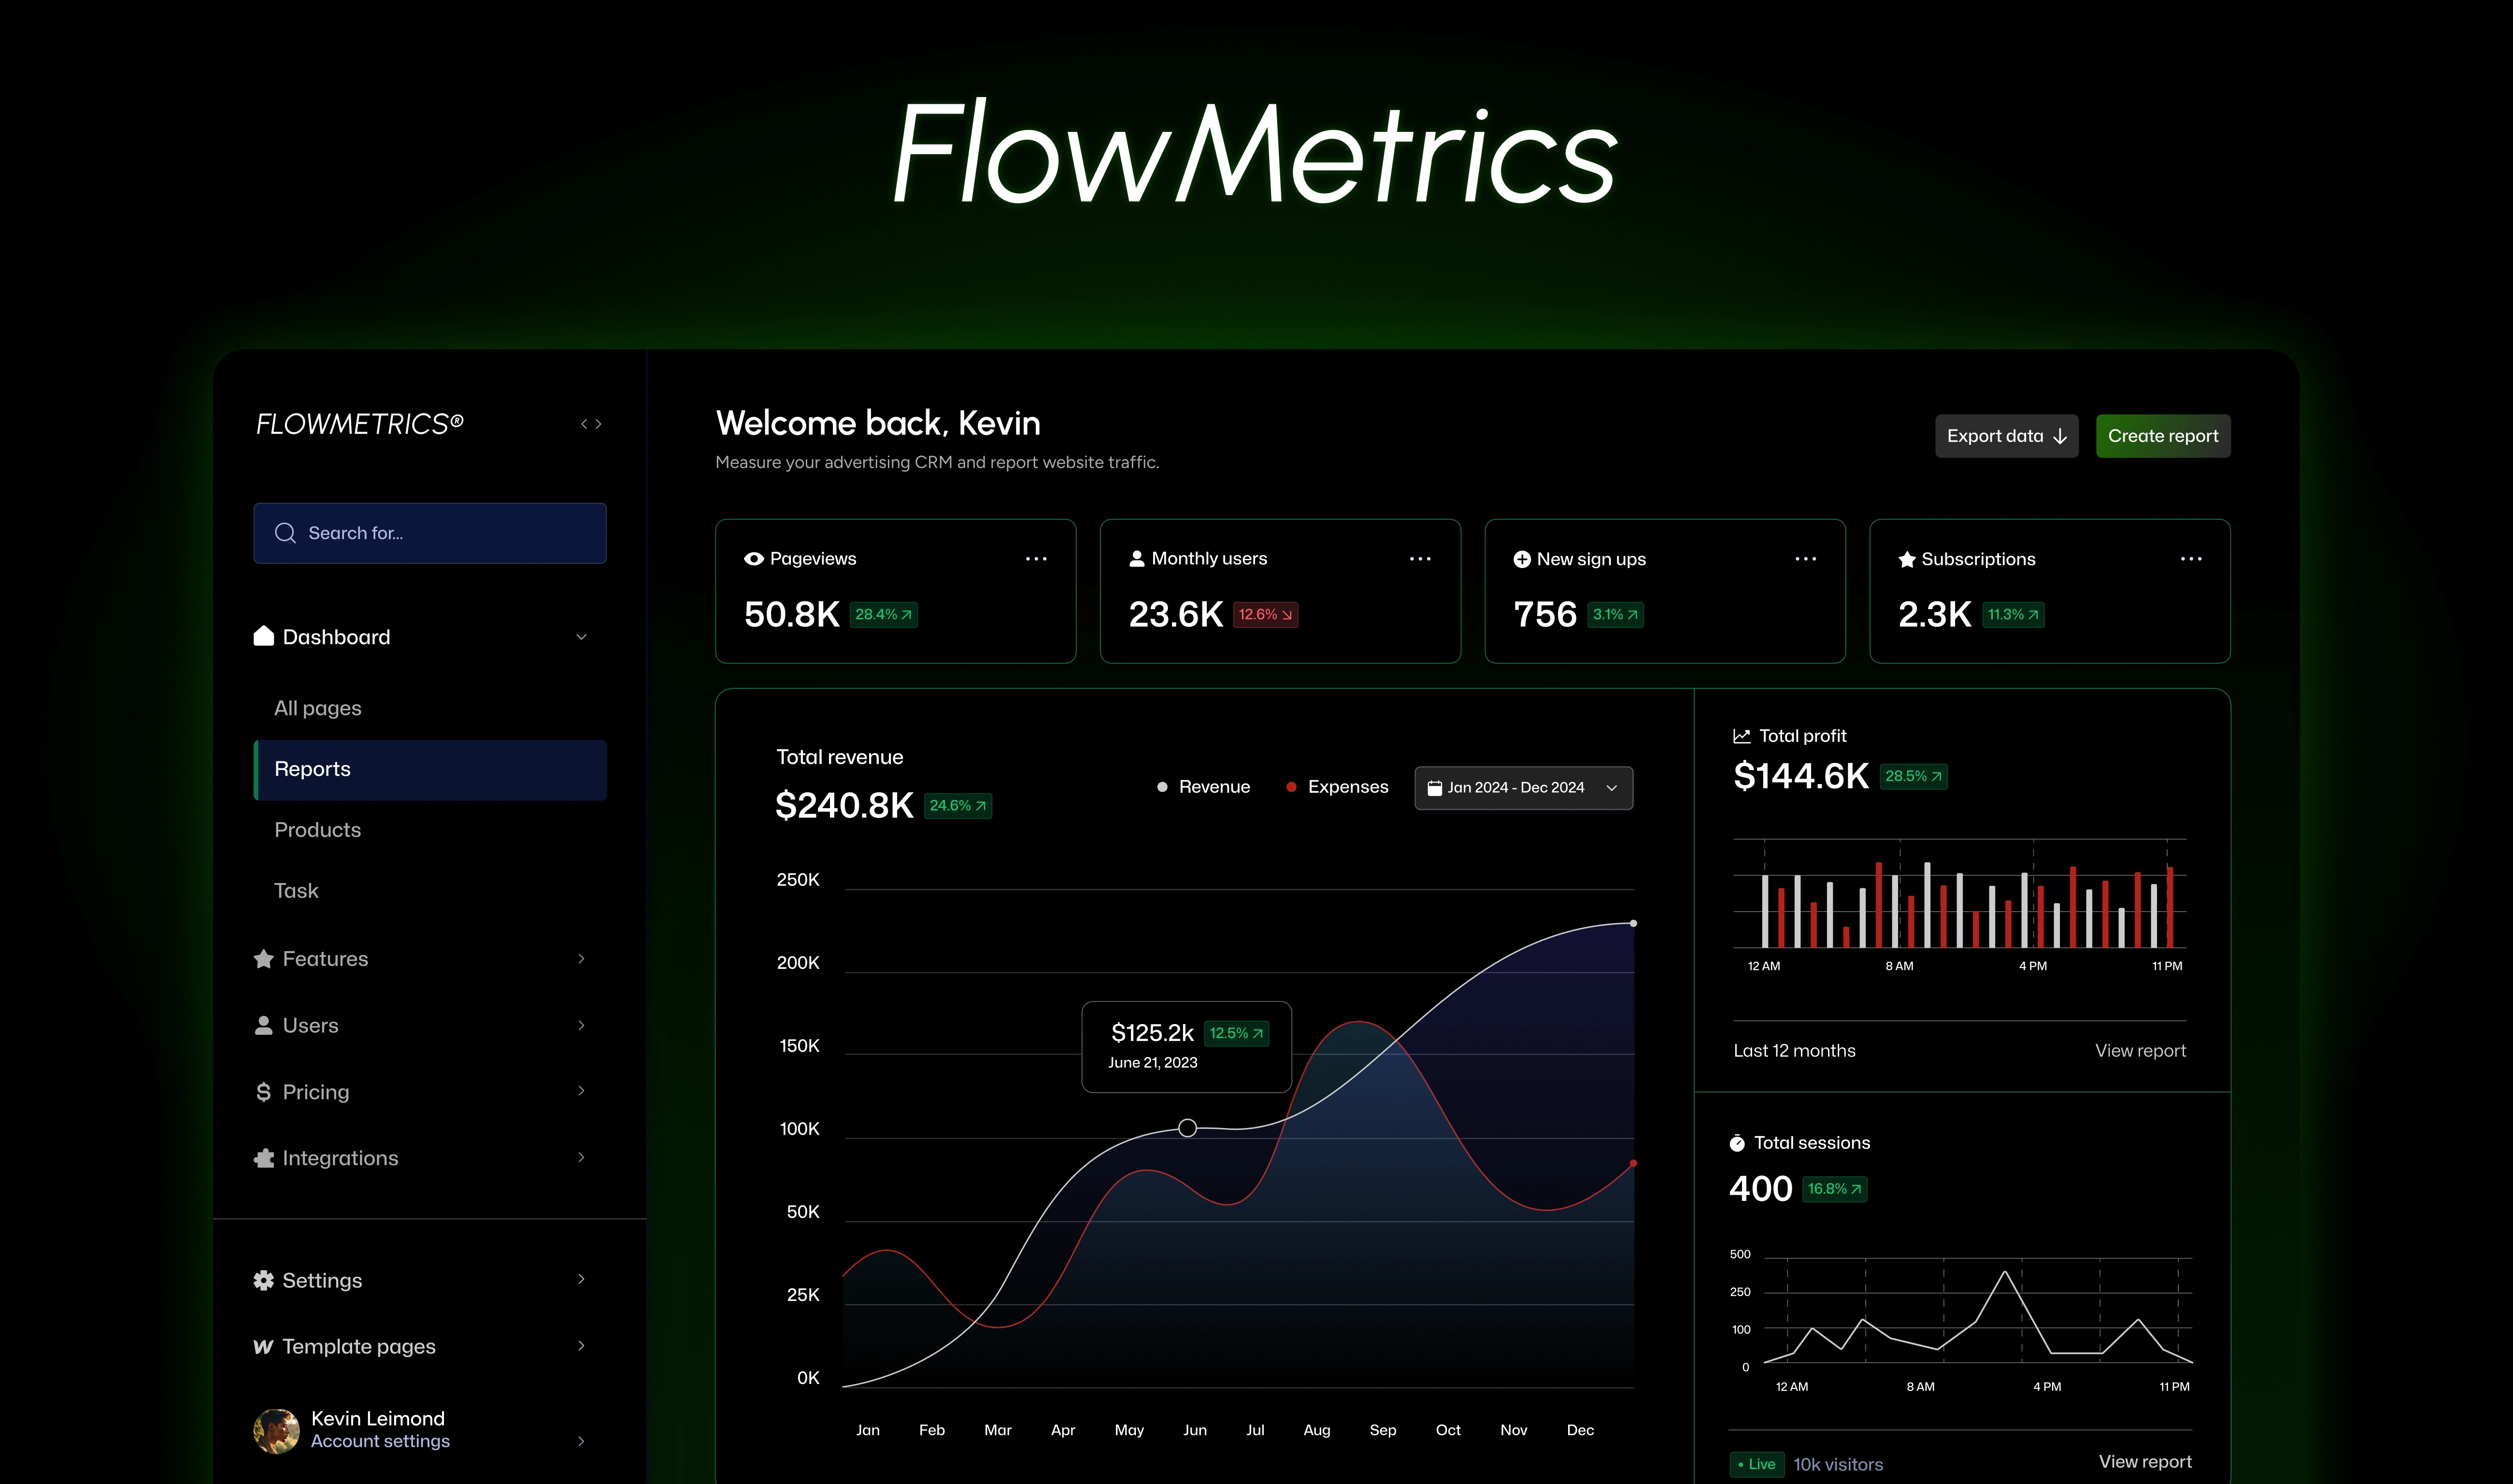
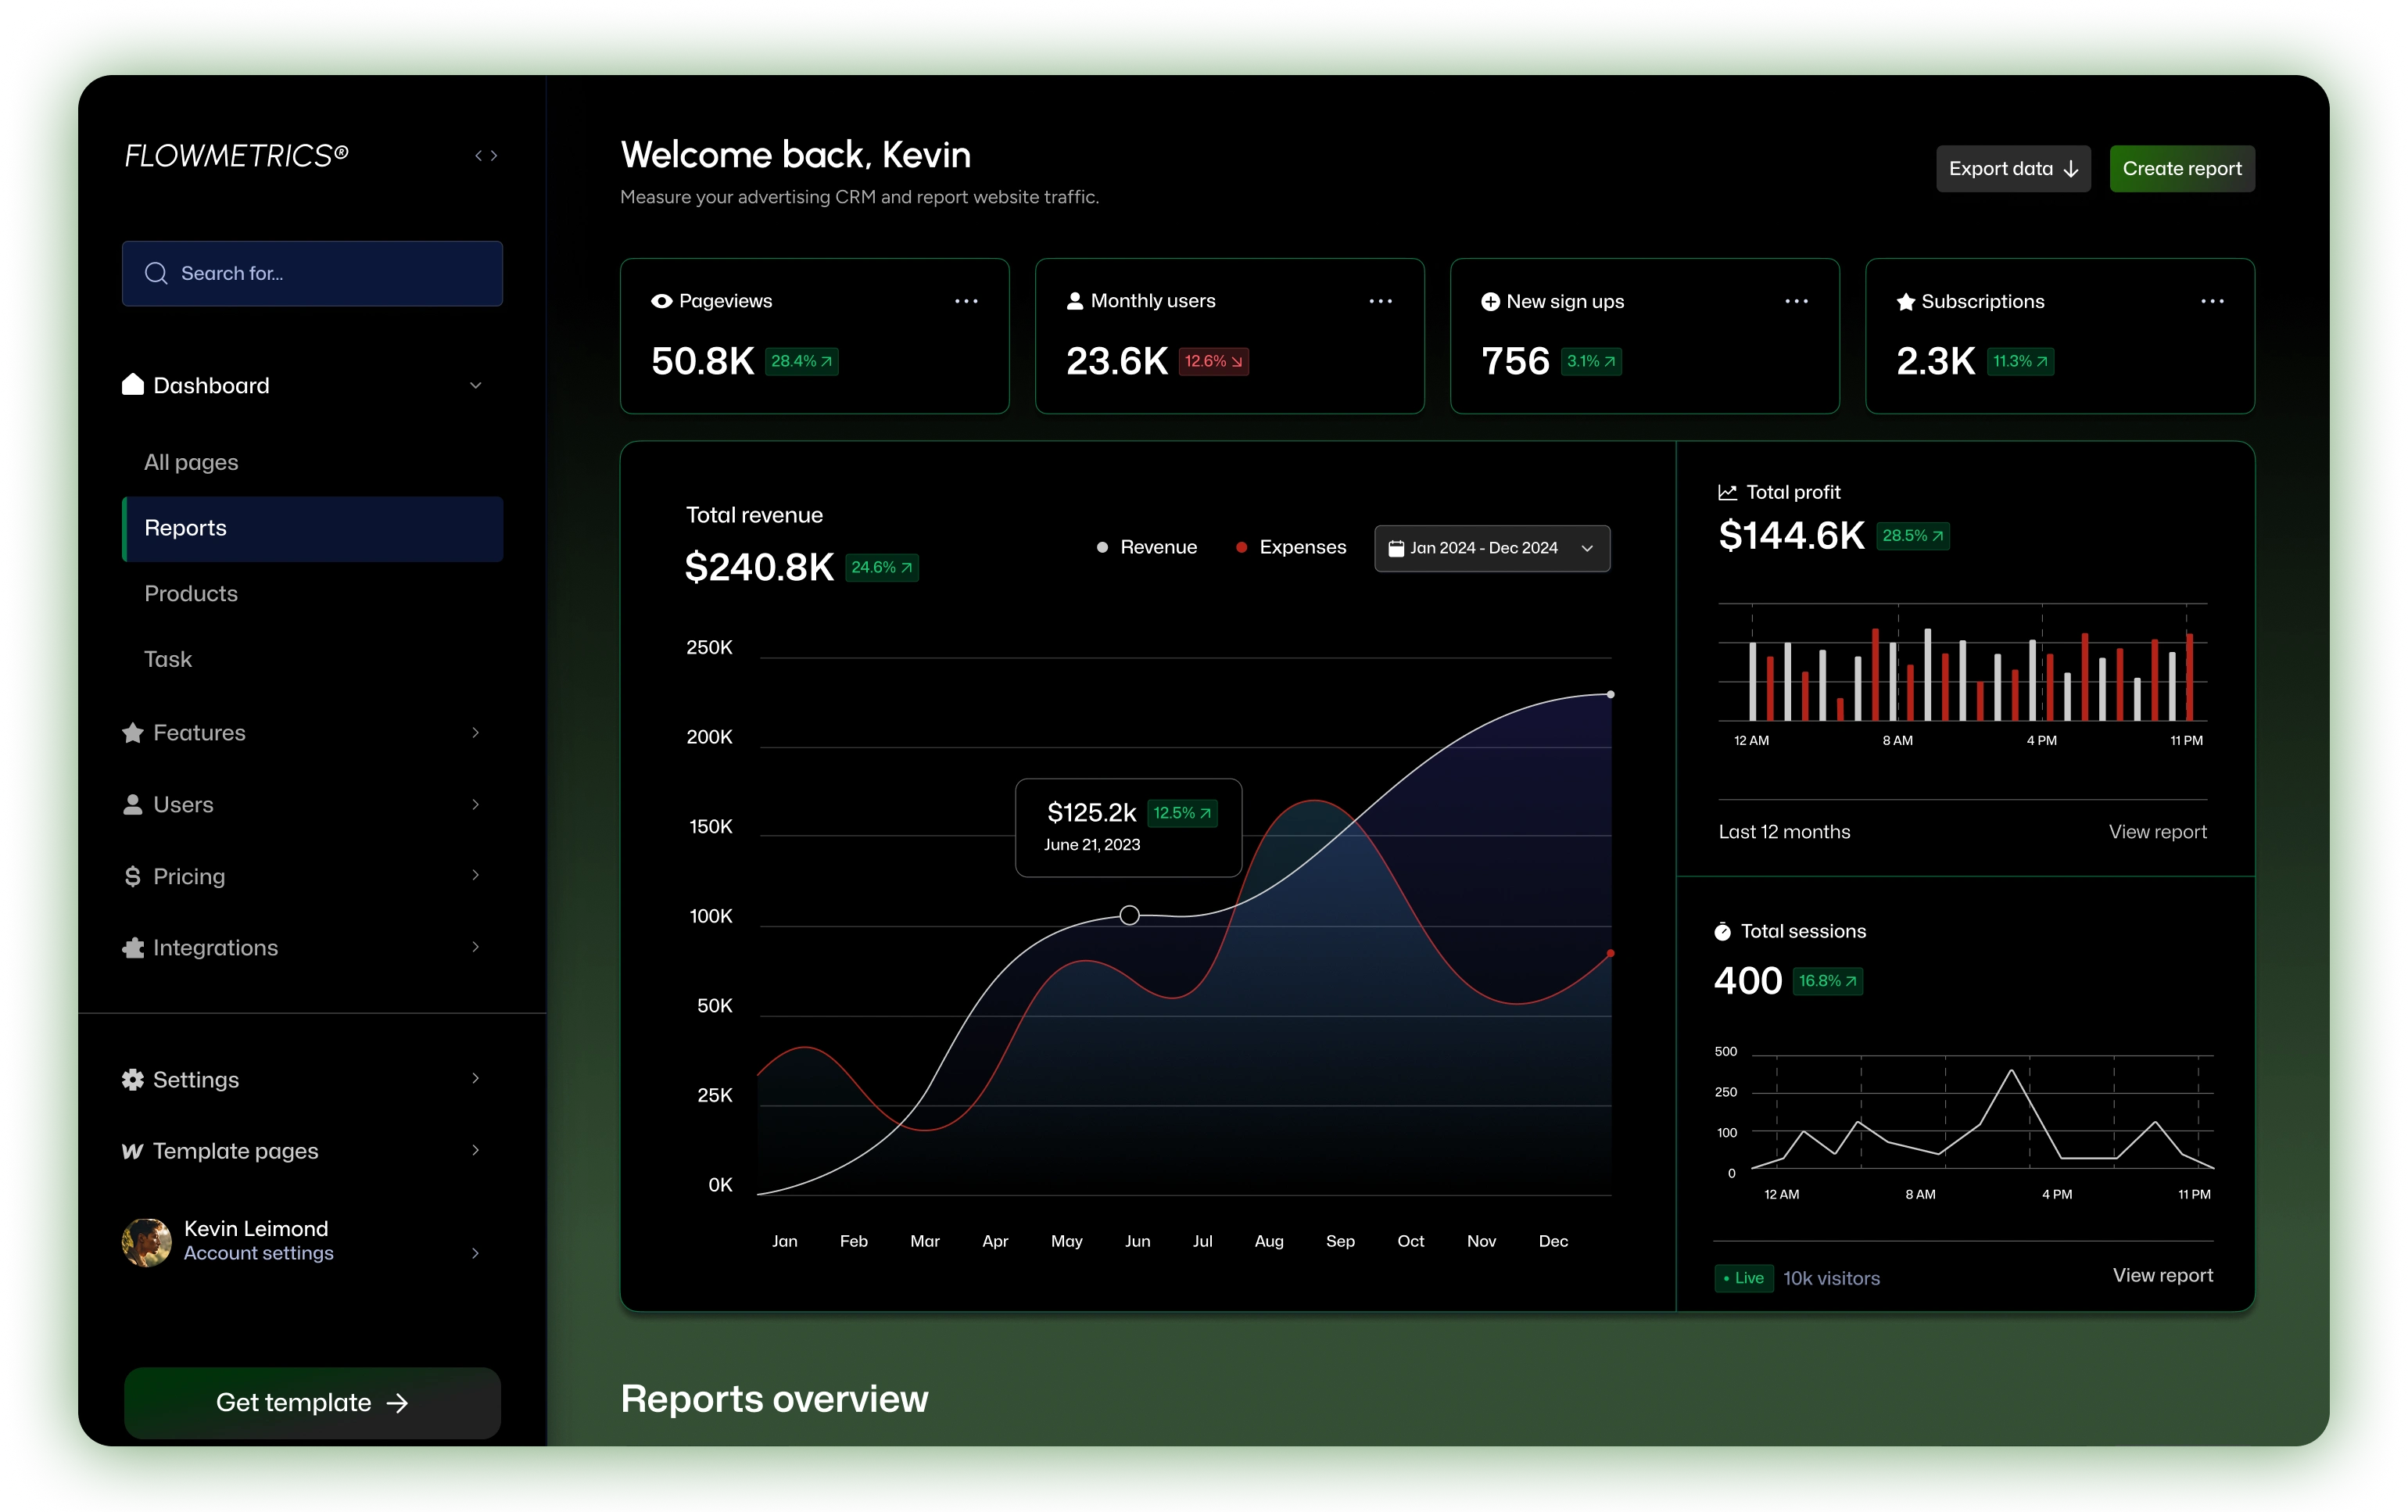
The goal was clear: build a sleek, easy-to-digest analytics platform that could plug into existing tools and extract workflow insights. Flowmetrics was not just another dashboard — it was designed to illuminate inefficiencies, speed up decision-making, and empower leaders with visibility across departments.
⚠️ Pain Points We Set Out to Fix
Teams lacked consolidated insights across platforms.
Project delays were recurring but causes weren’t traceable.
Ops leaders had no way to measure flow efficiency at scale.
Most analytics tools were too general or too cluttered.
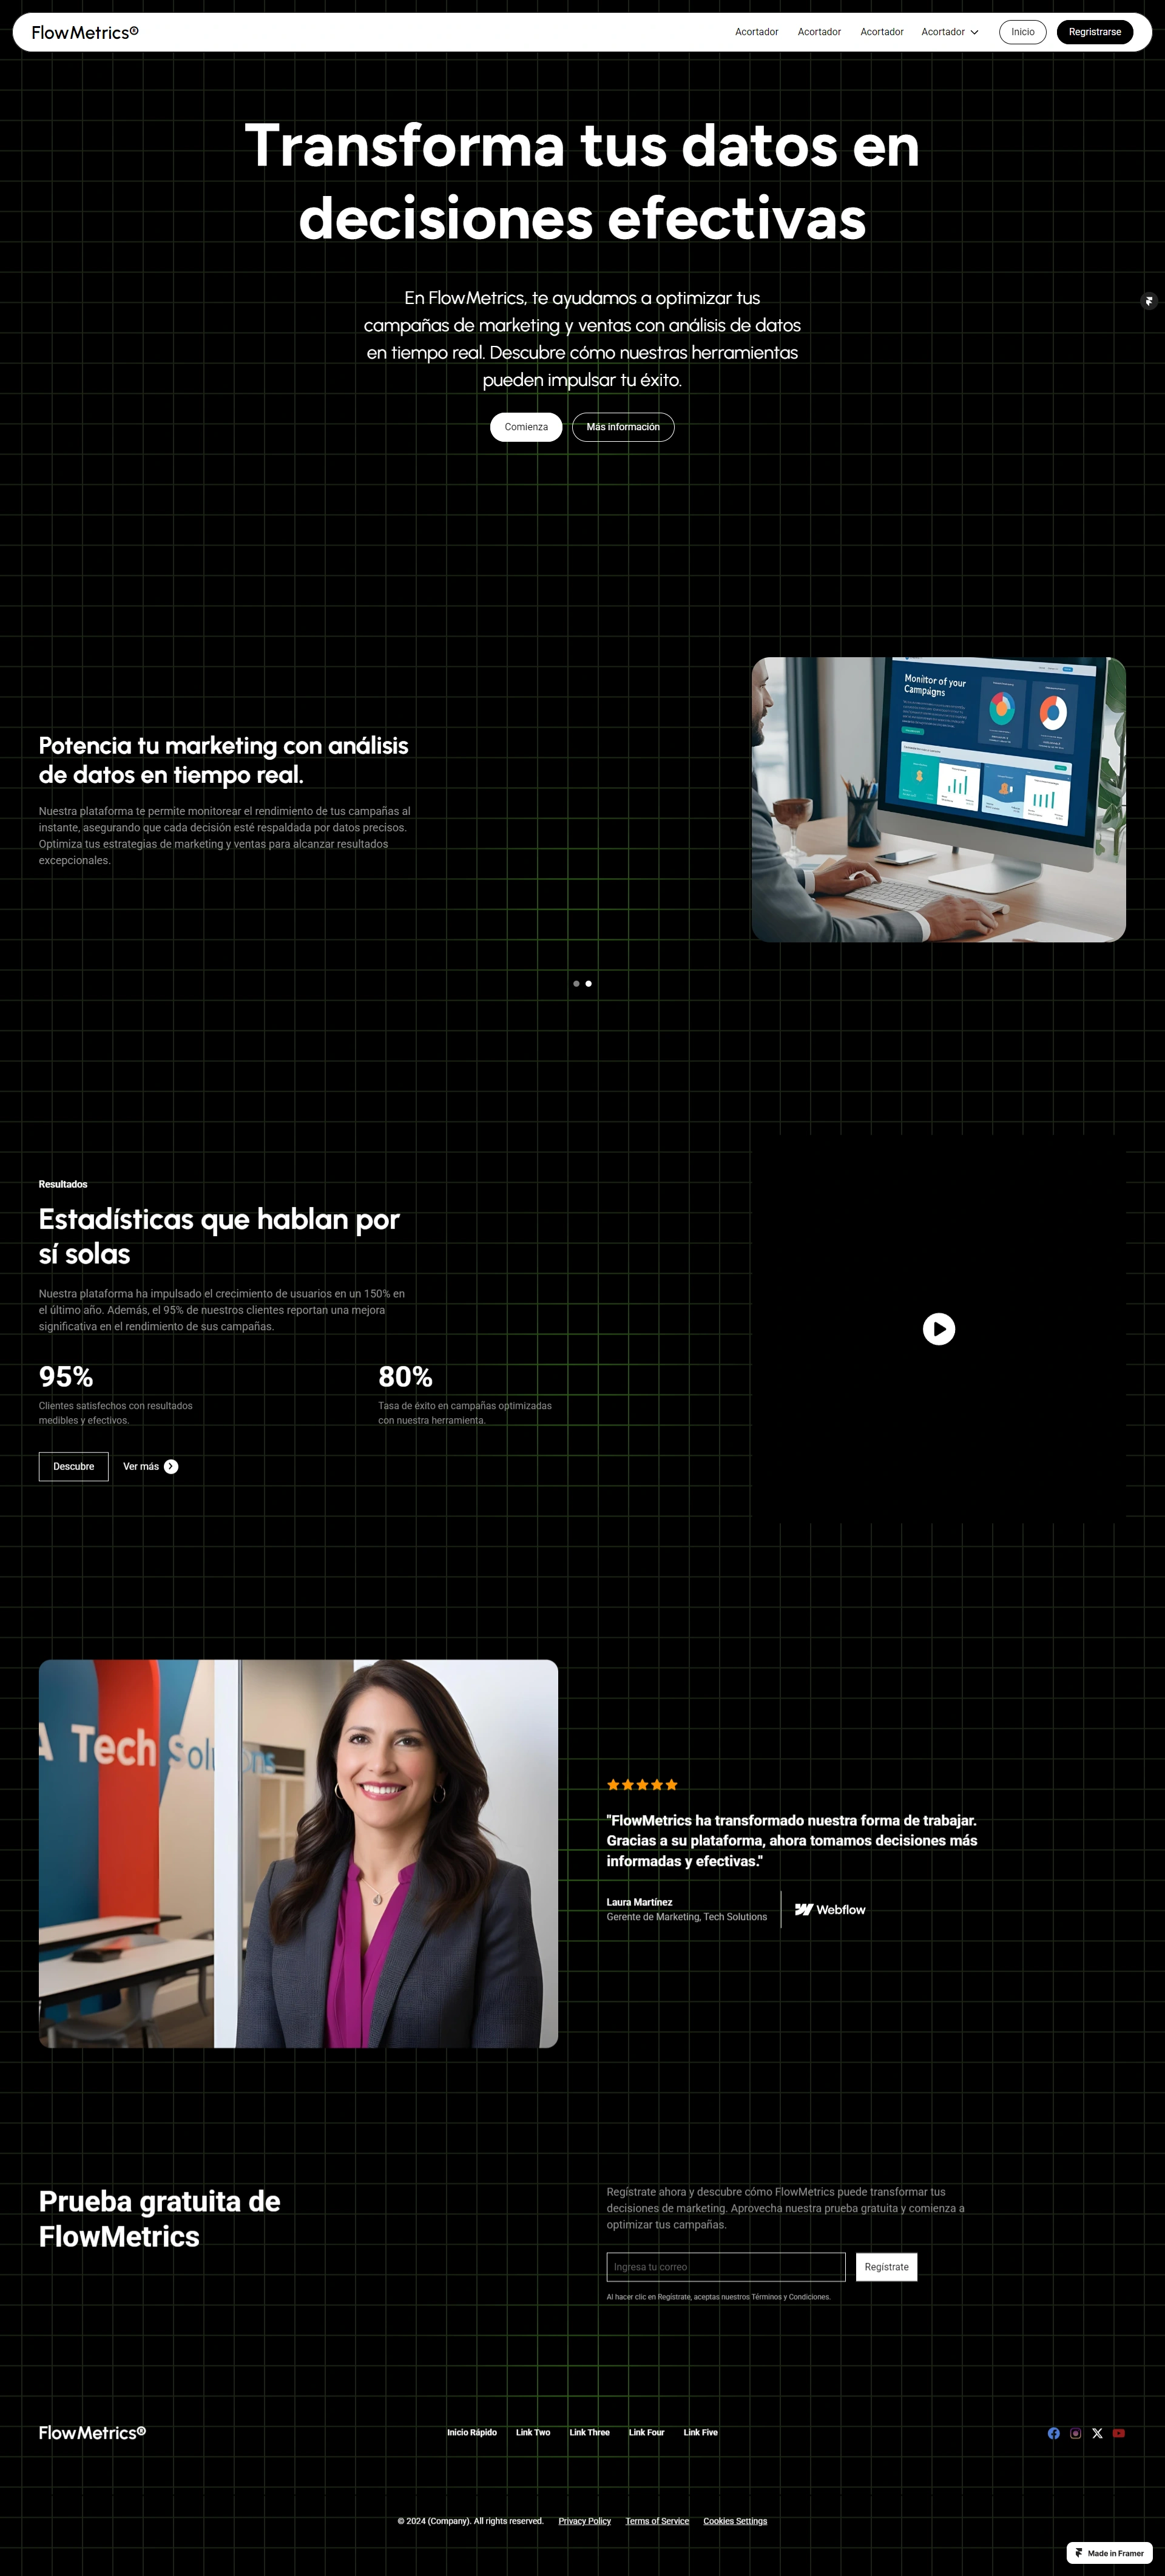
⚙️ How We Solved It
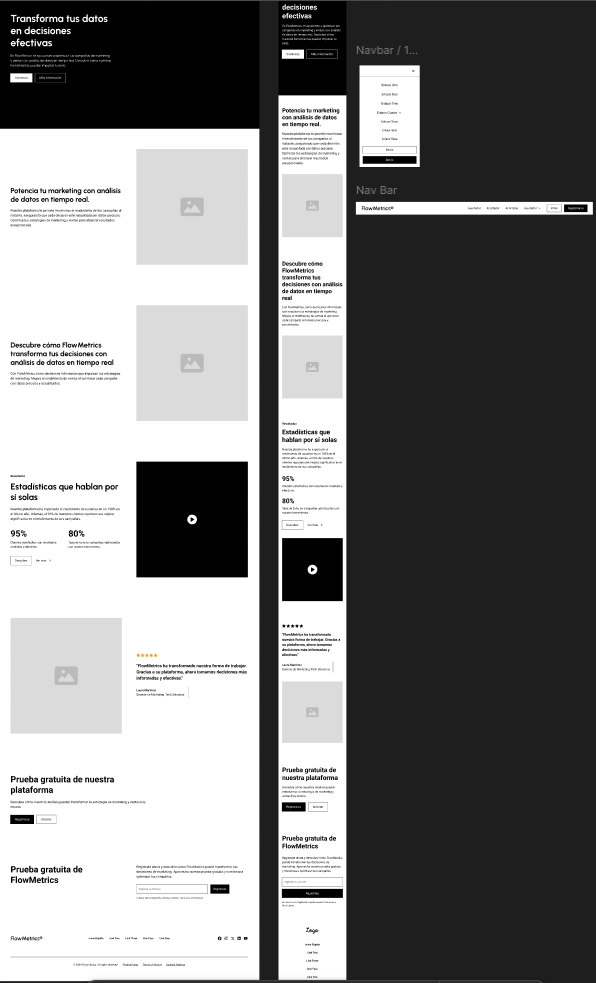
We crafted a visual language built on clean lines, soft gradients, and clear hierarchy, letting data take the spotlight. We designed custom icons for each type of metric, implemented a modular UI for flexibility, and built the layout with scalable components ready for integration.
🚀 The Impact
The final design achieved three critical outcomes:
Accelerated reporting across teams by 2x (mock data testing).
Enabled non-technical users to read complex metrics easily.
Created a B2B-ready identity that feels premium but intuitive.
Like this project
Posted Jun 5, 2025
High-impact web design for a SaaS focused on internal analytics. Clear, modern interface aligned with B2B business goals.
Likes
1
Views
24
Timeline
Mar 1, 2025 - Mar 8, 2025
Clients
Personal Project