
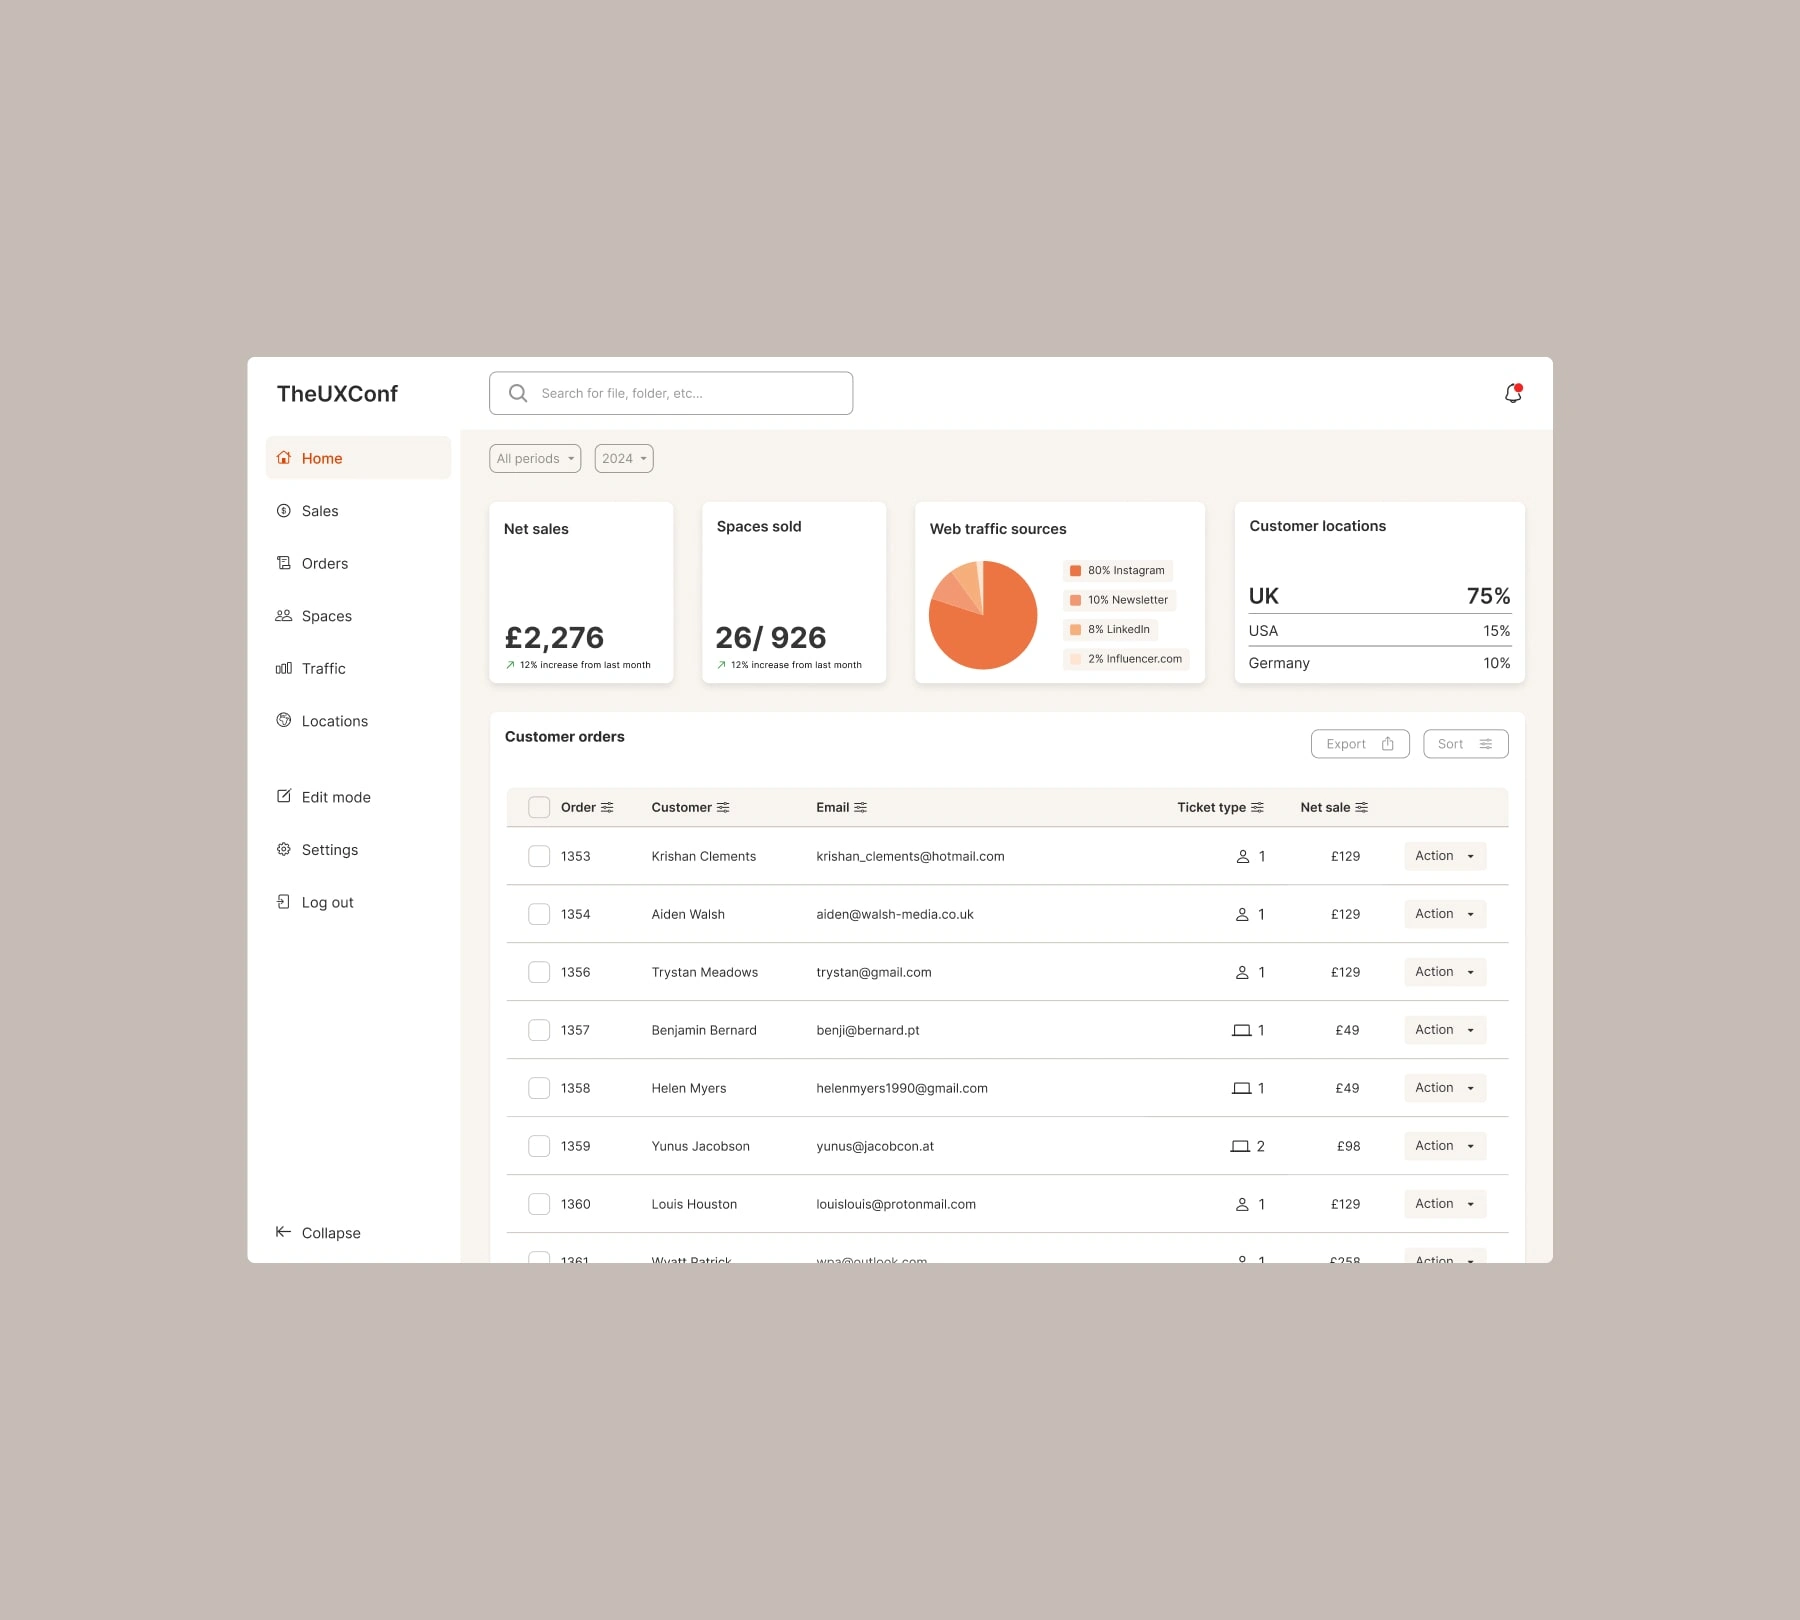
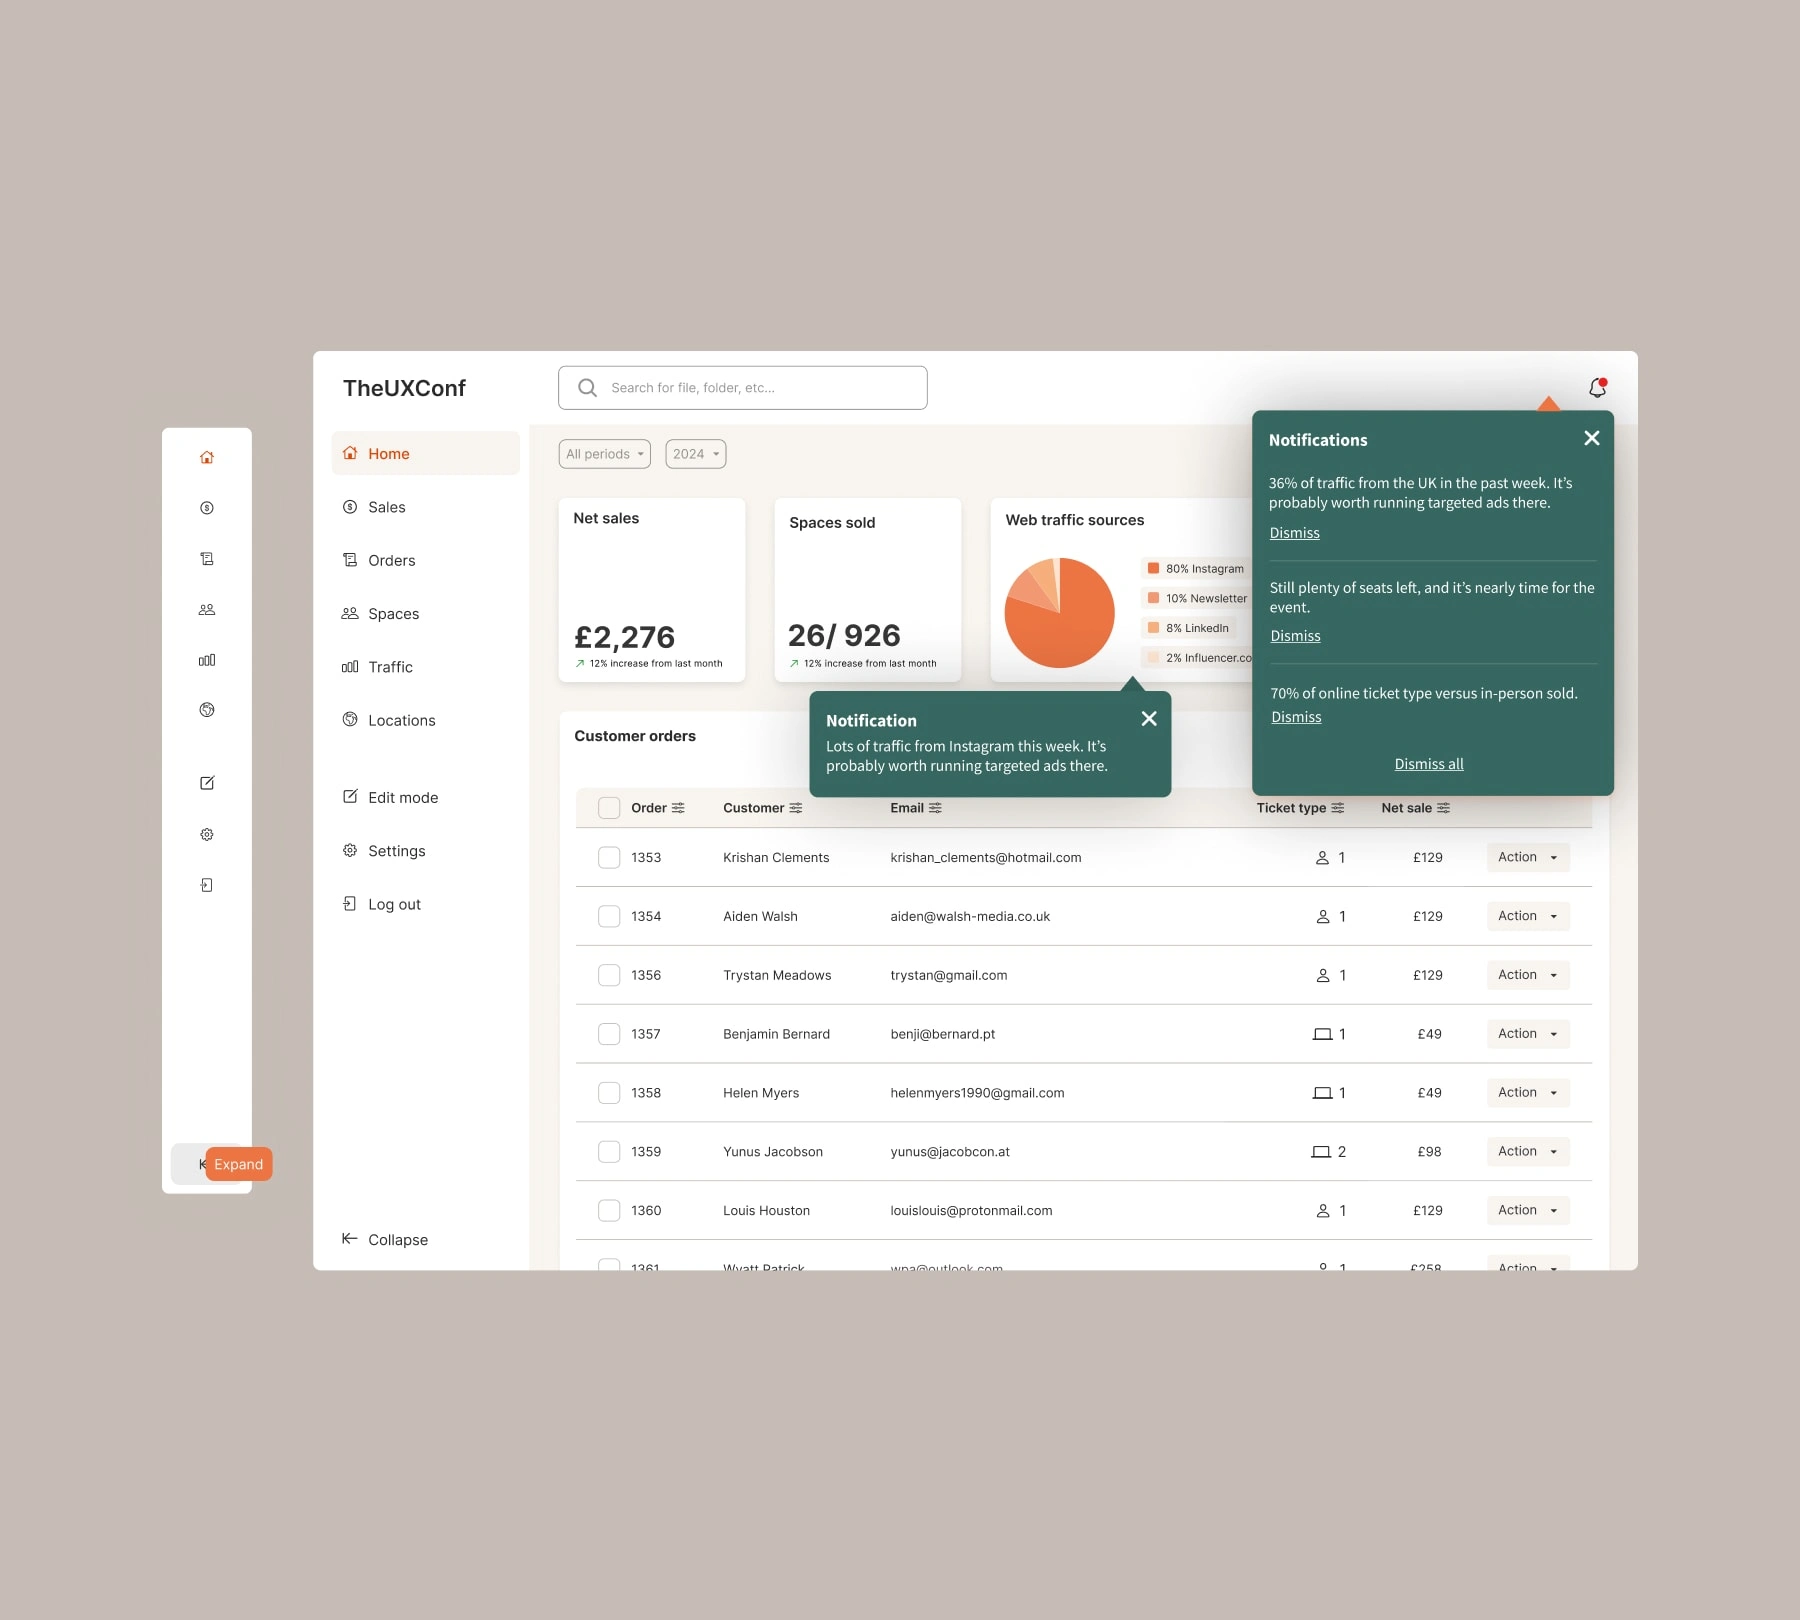
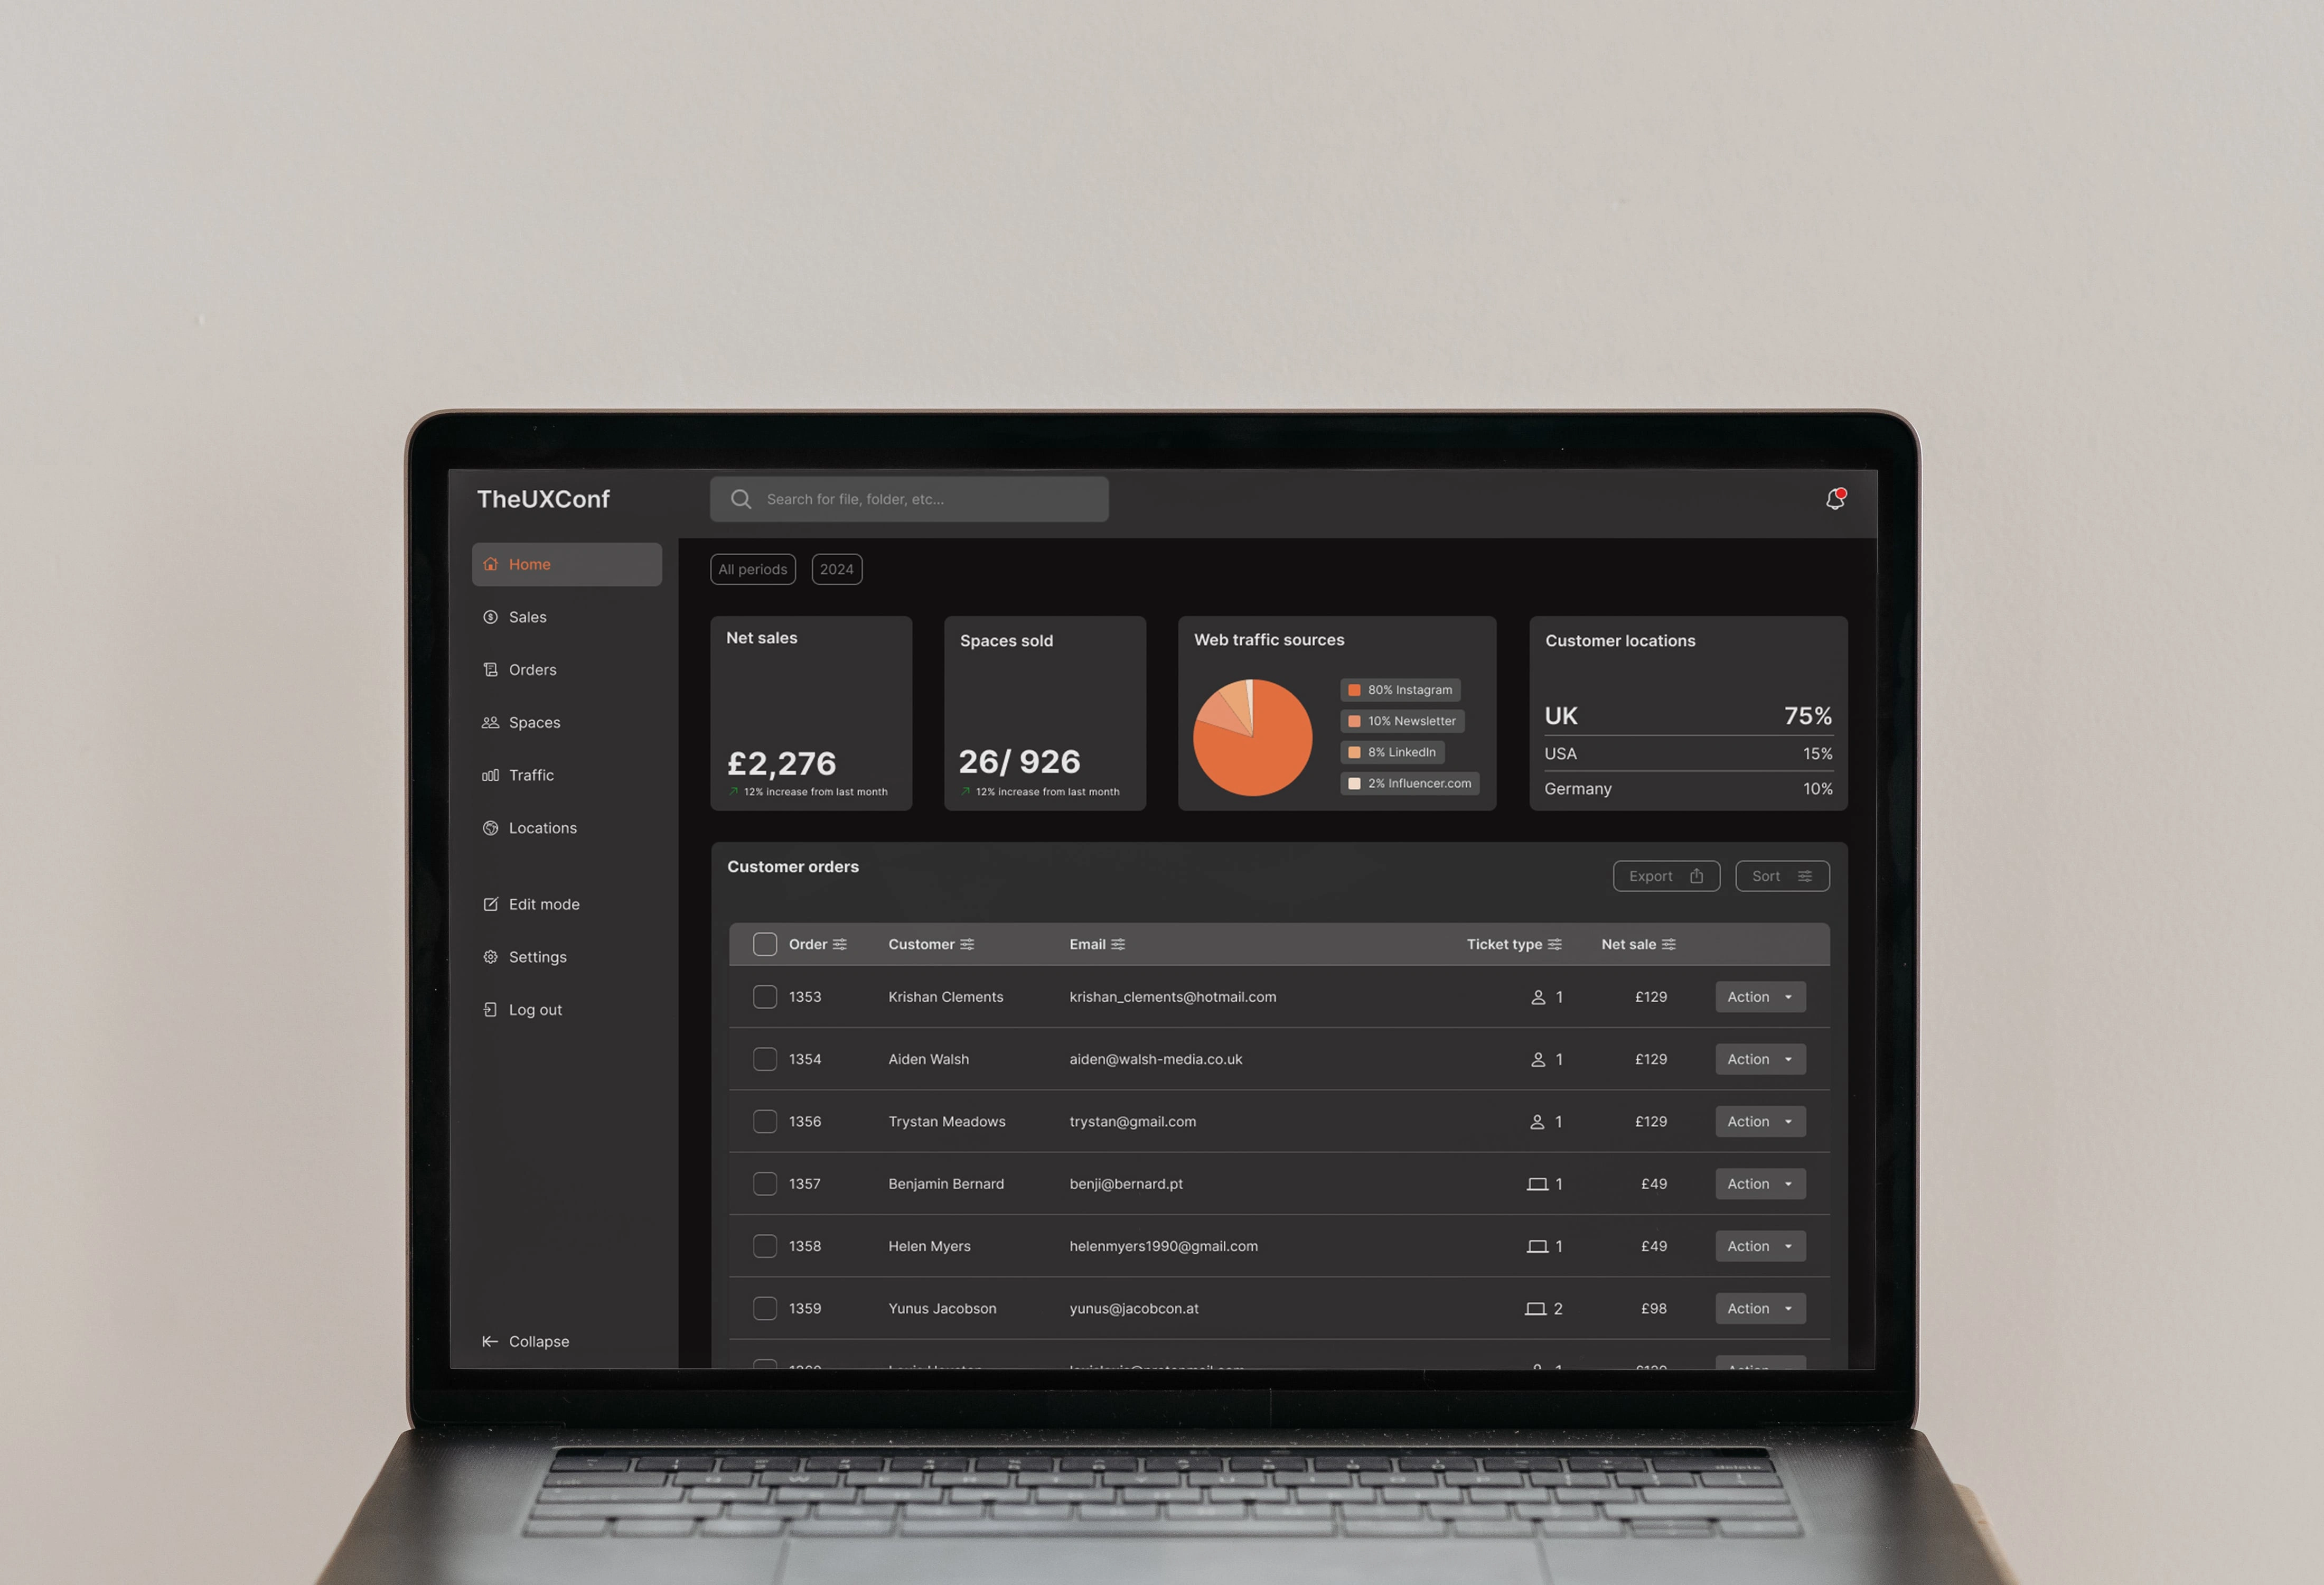
Dashboard concept for The UX Conference. The UX Conference utilises EventBrite for ticket sales and monitors ad traffic and engagement on four distinct channels. The objective was to enhance event management efficiency by consolidating all tasks into a unified dashboard.
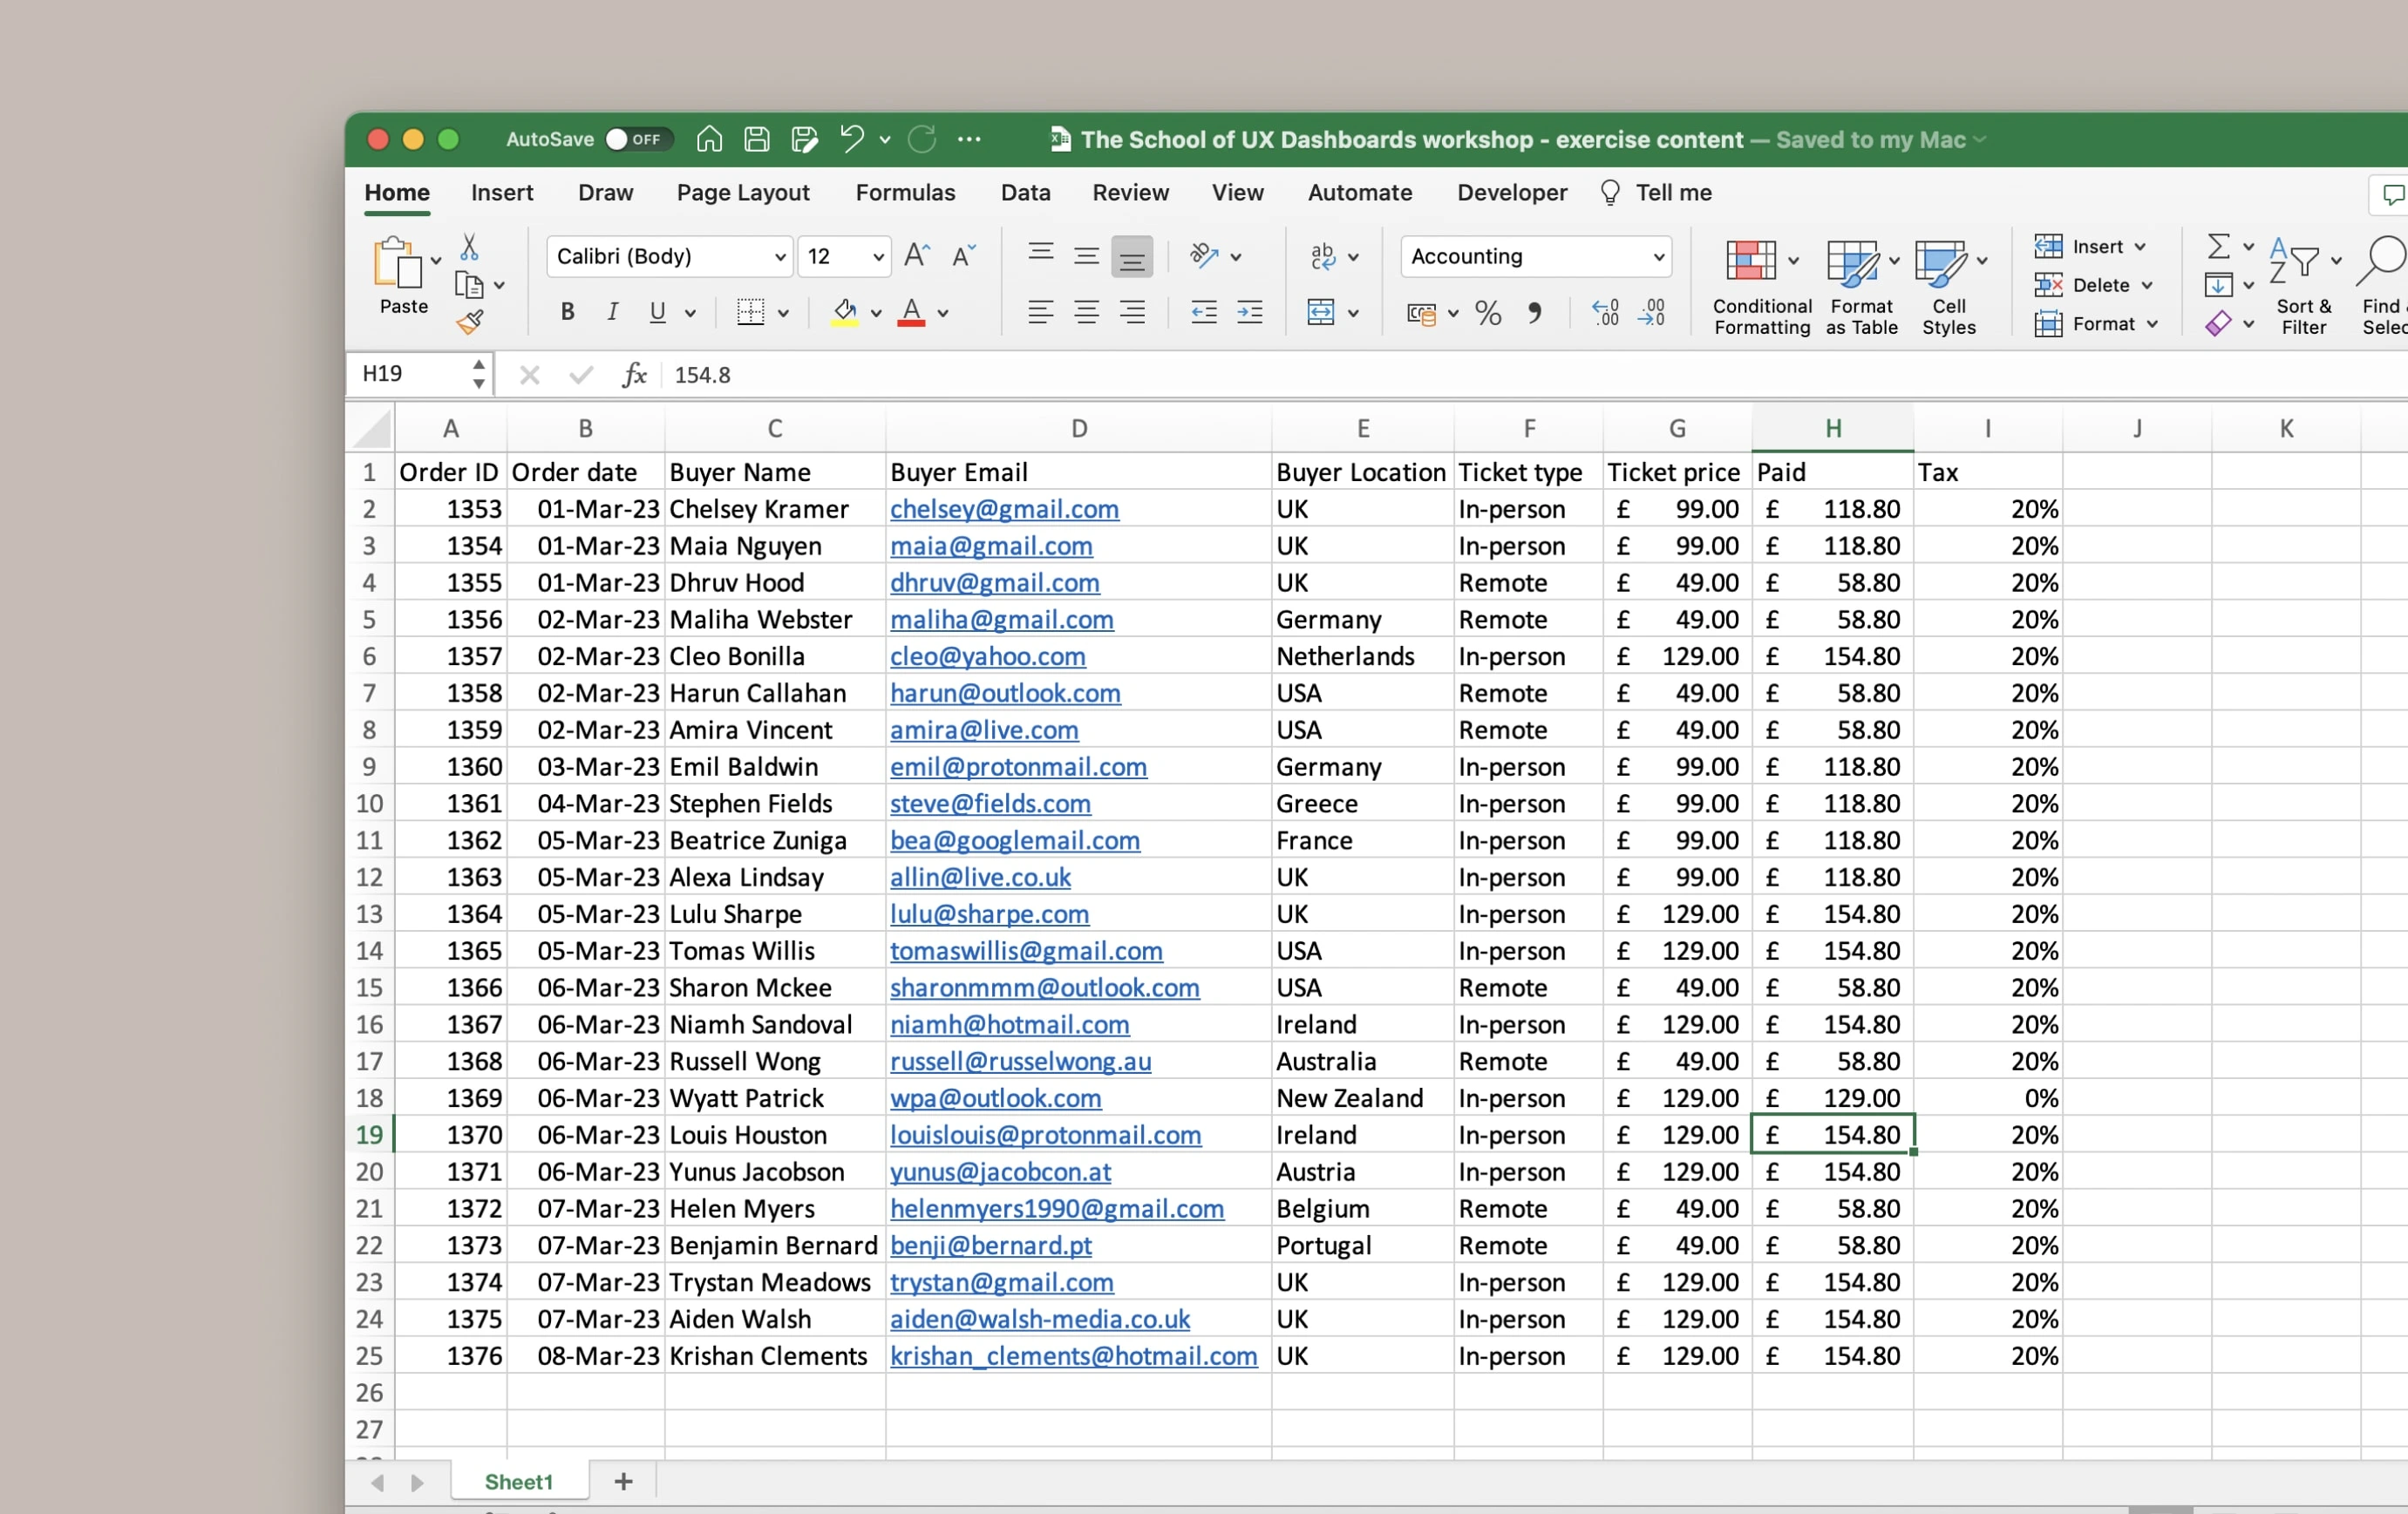
Although it might look simple (no snazzy UI here), it has taken hours and hours and hours to translate data from a spreadsheet to this point (and it's not finished!)
Some of the challenges:
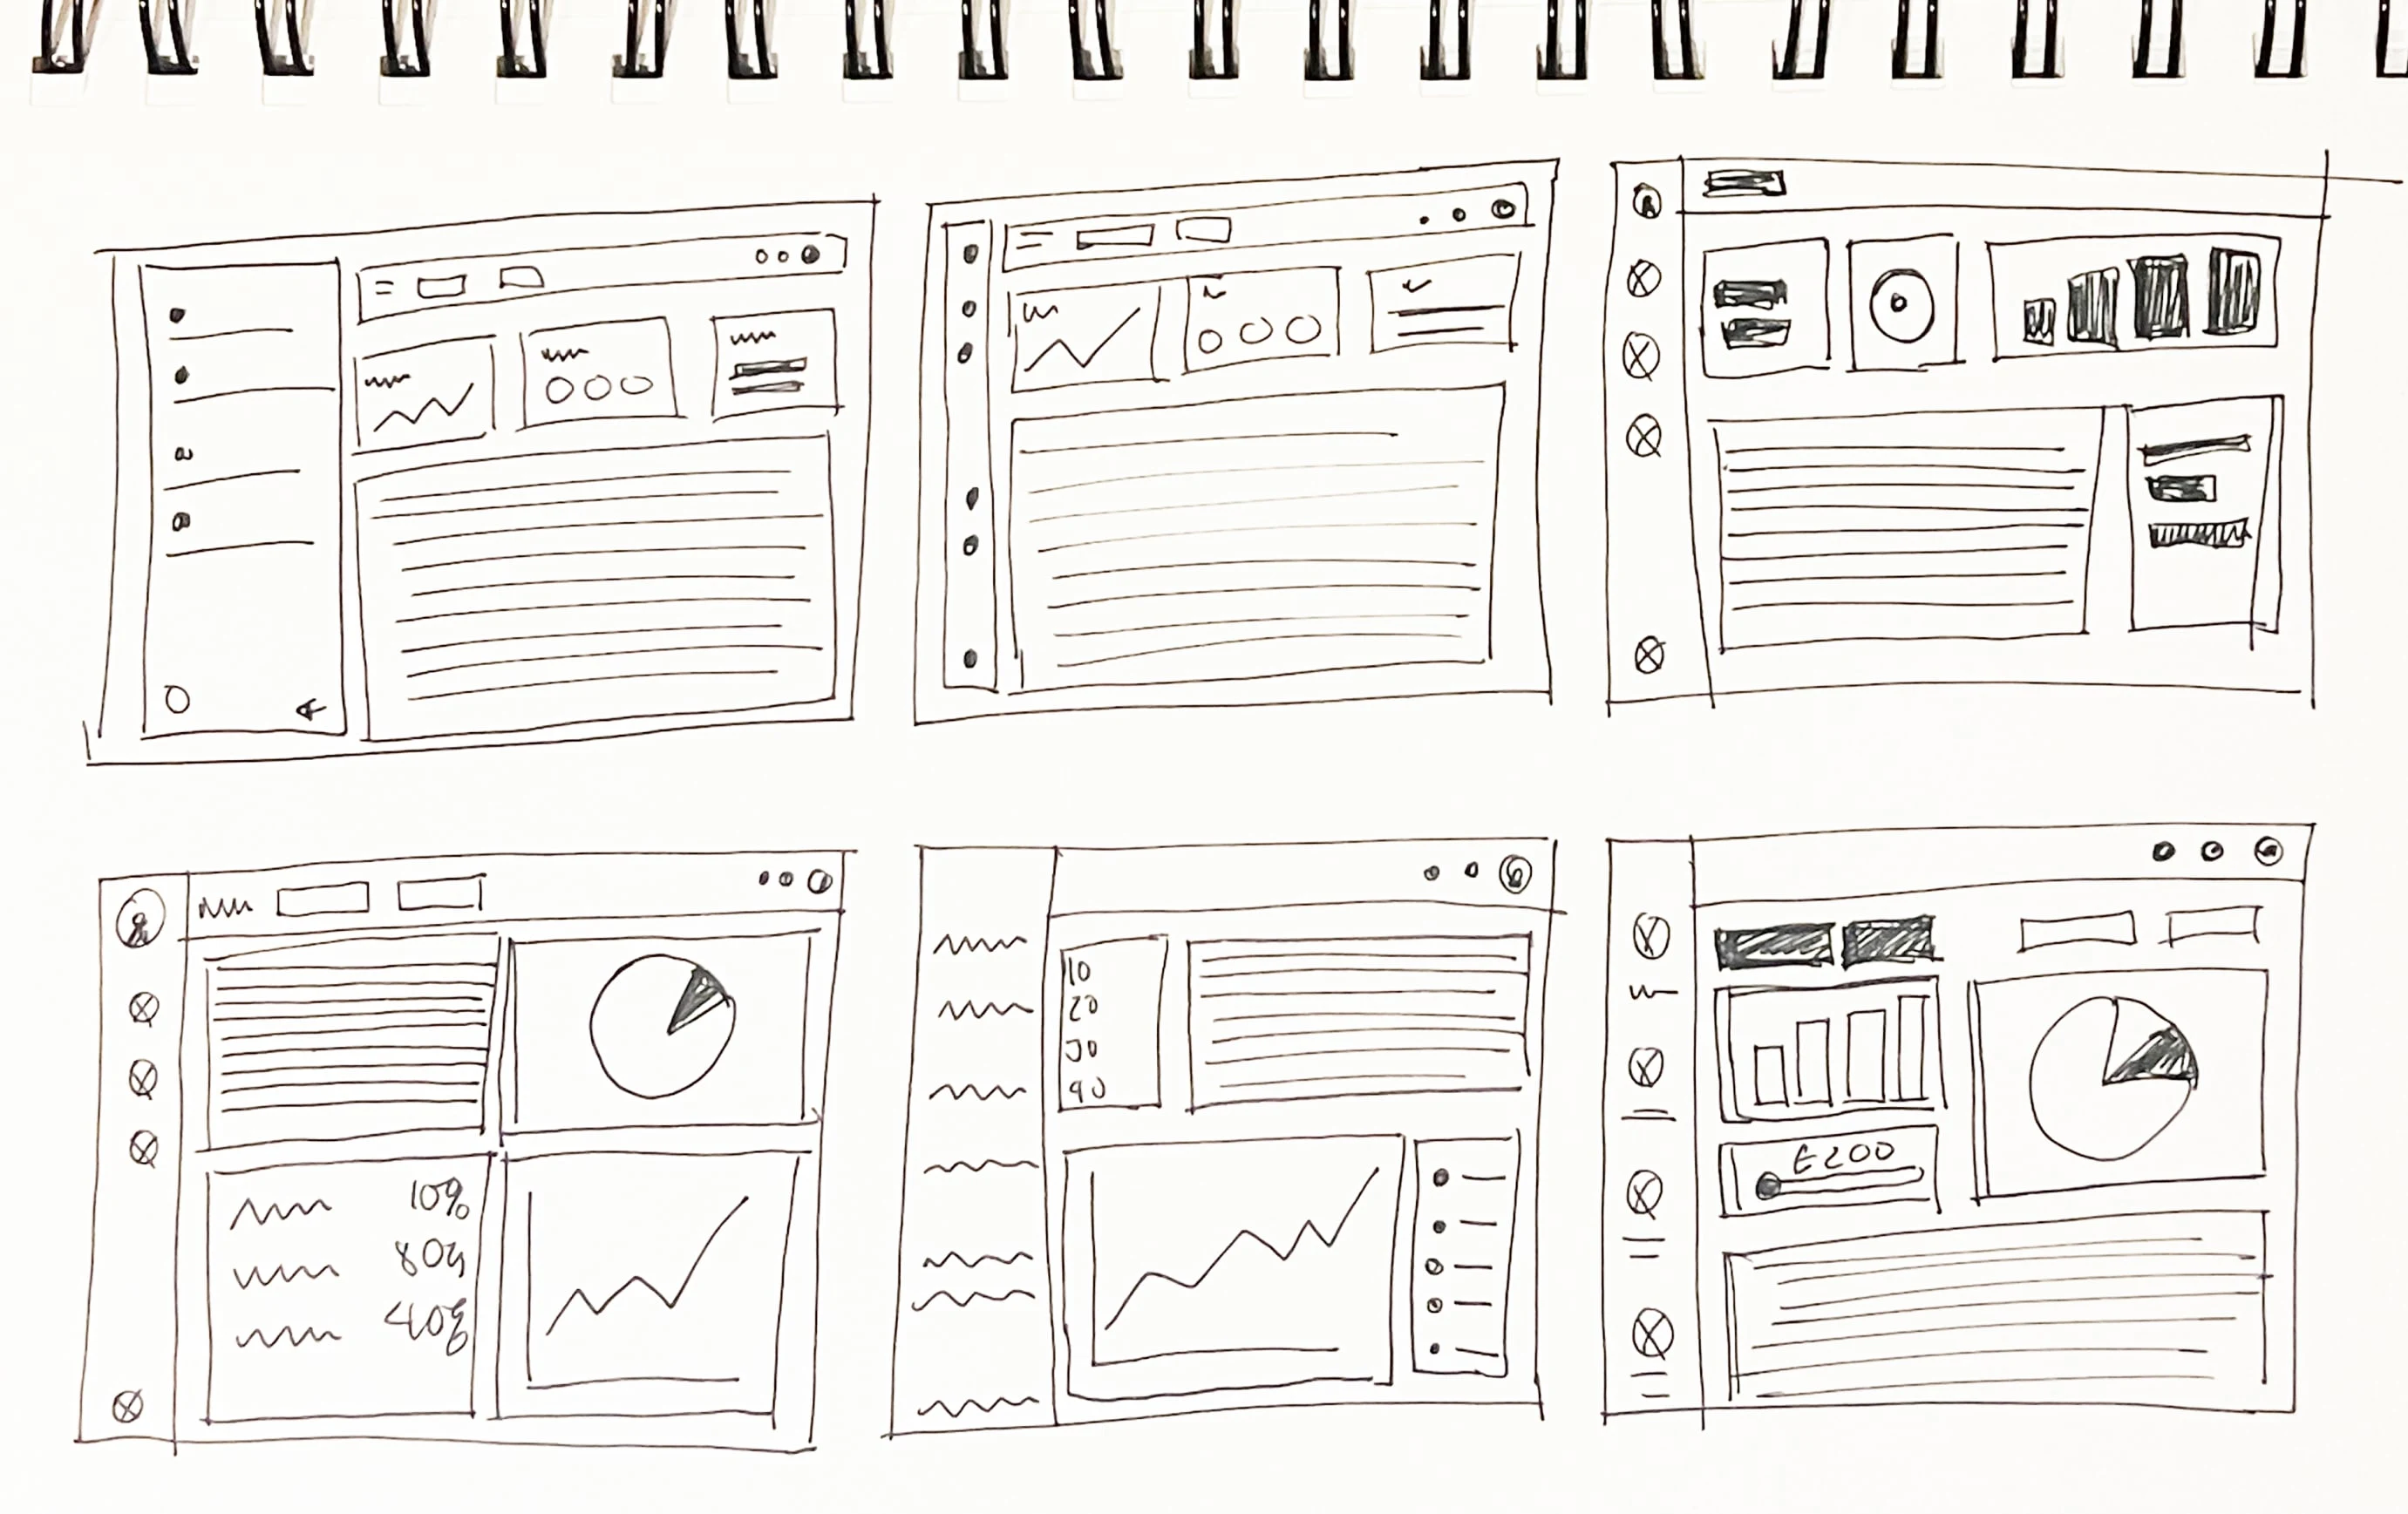
⚖ Balancing the display of relevant information without overwhelming users
📊 Selecting the right data visualisations for different types of information.
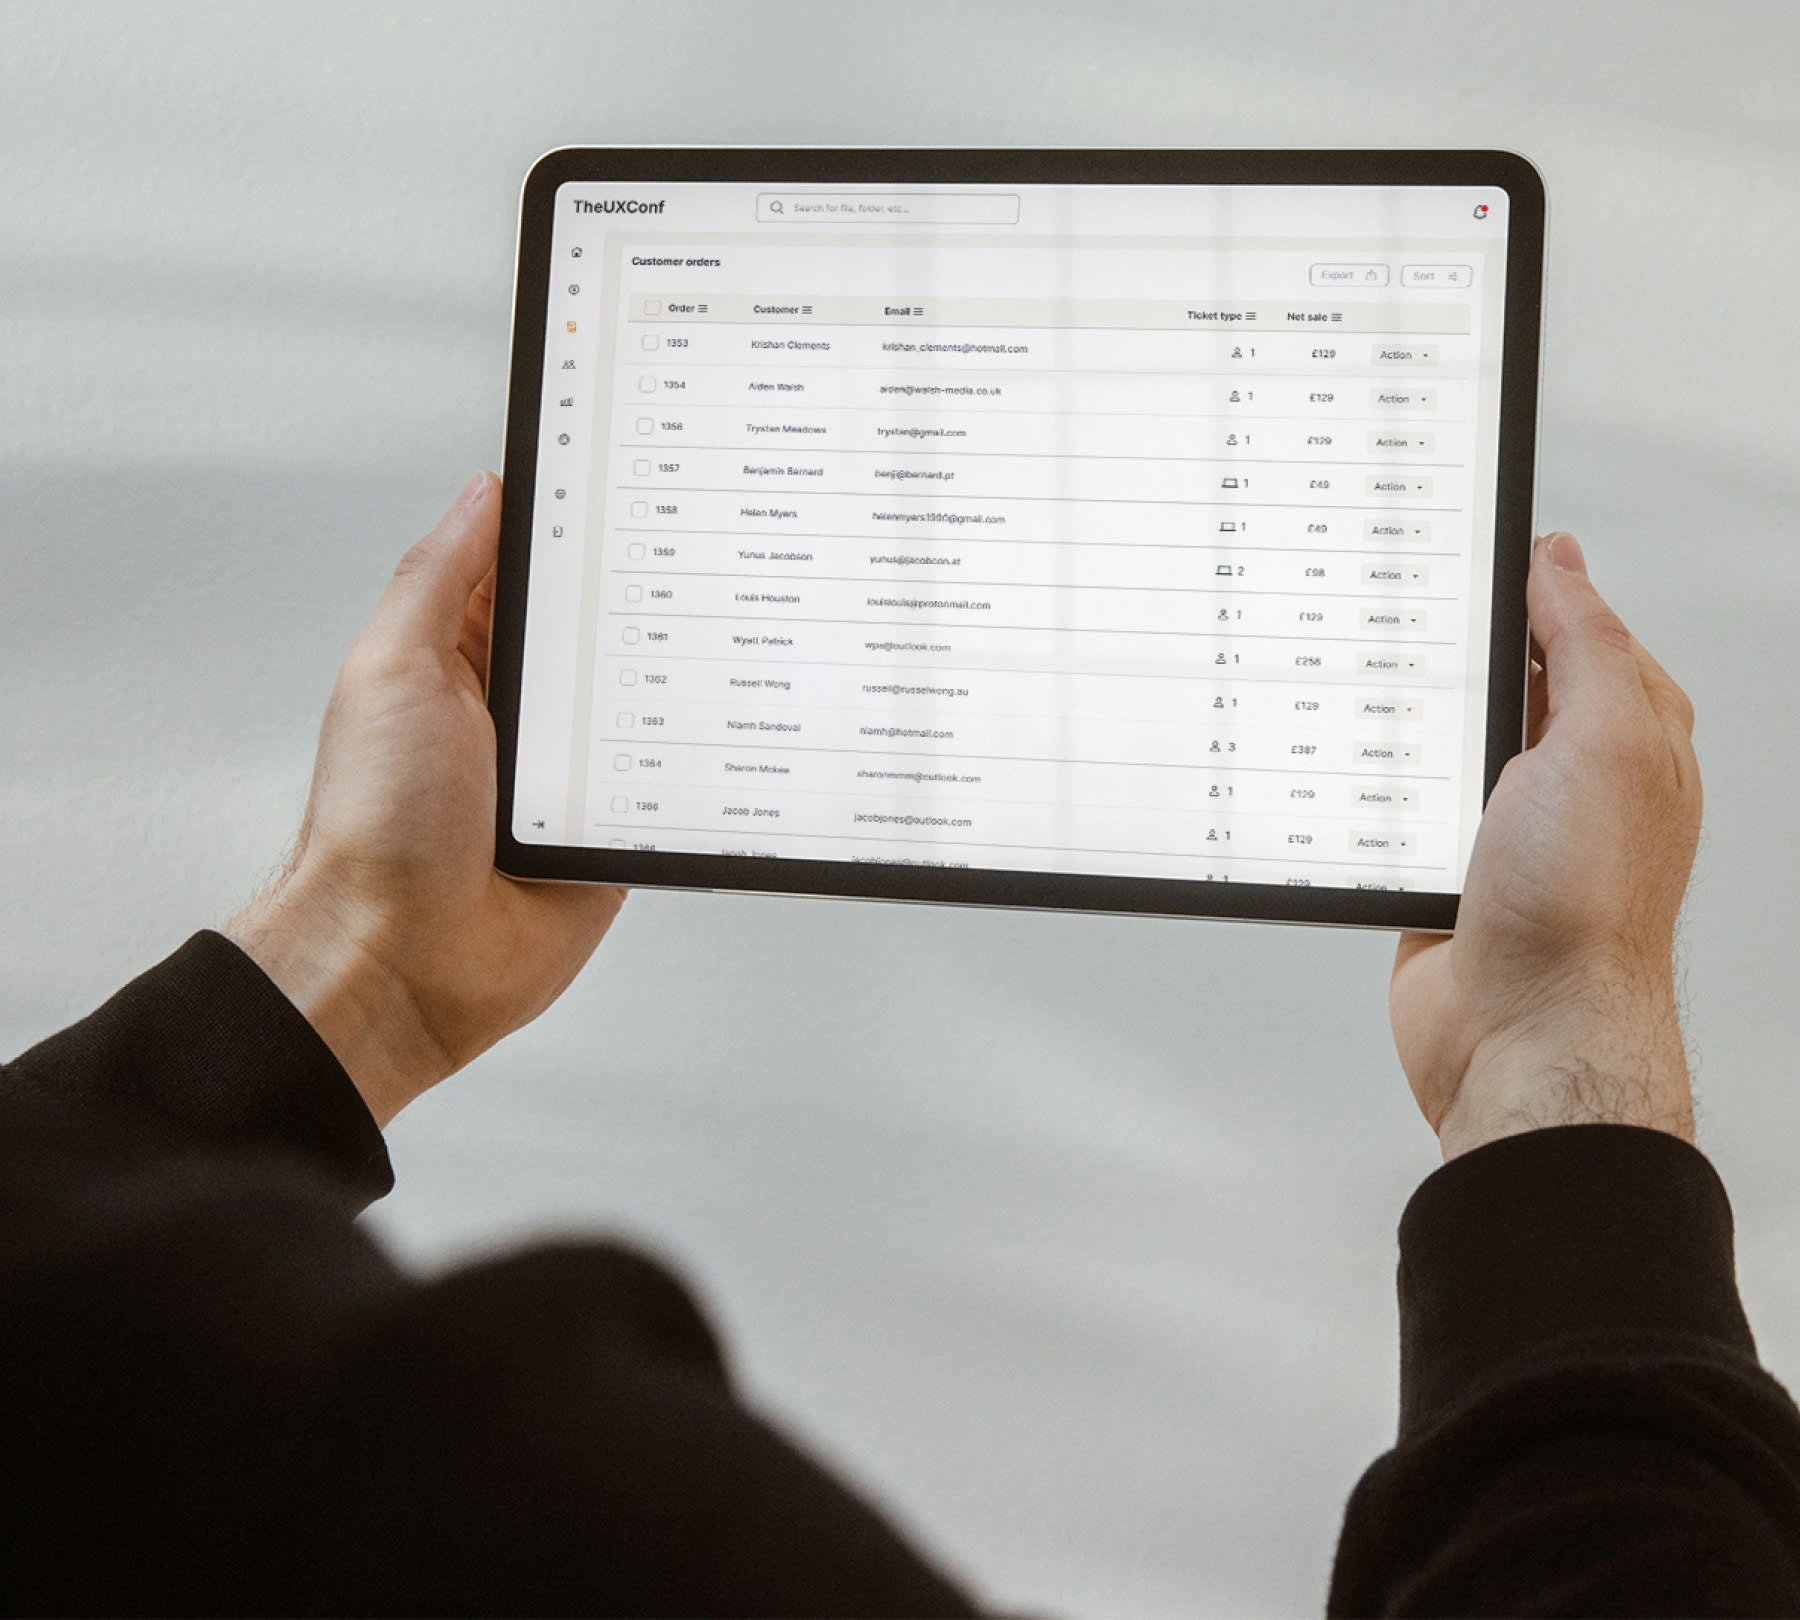
👩💻 Maintaining consistency in design elements, features, and functionality across devices
🗺 Designing intuitive navigation for users to easily explore different sections of the dashboard.
I'm currently working on interaction design such as hover effects to highlight elements on mouse-over and tooltips to offer additional context and information on data points.
Add in the Figma challenges of components and auto layout and you've got yourself quite a monster task!
0 likes · 12 views · Jun 19, 2024
Dashboard concept for The UX Conference to track ticket sales.
