Market Trend Analysis for E-Commerce
Khizran Adabanija
Market Trend Analysis for E-Commerce
INTRODUCTION
The project is an assessment based on market trends for an E-commerce business, insightful solutions were proffered.
Tools used: Excel, SQL, Power BI
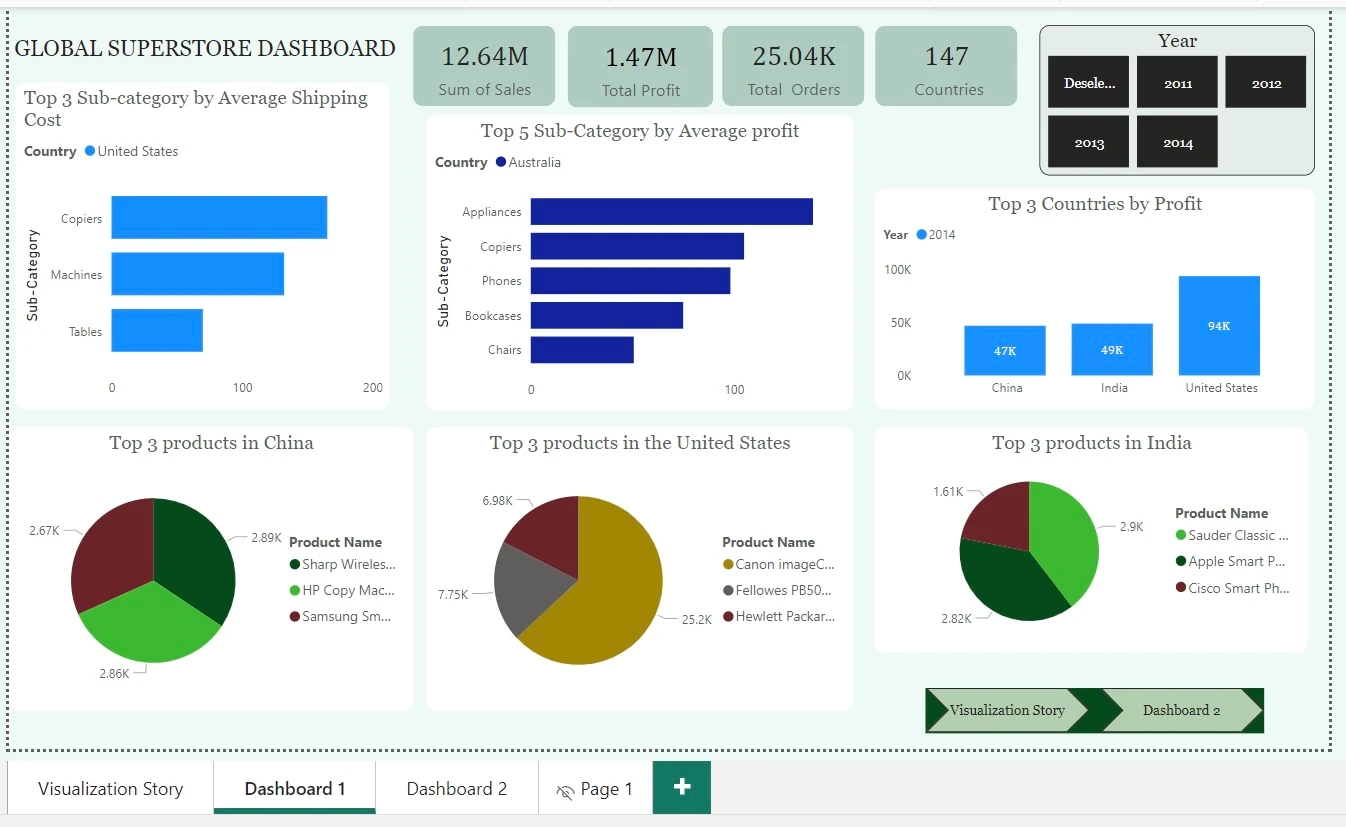
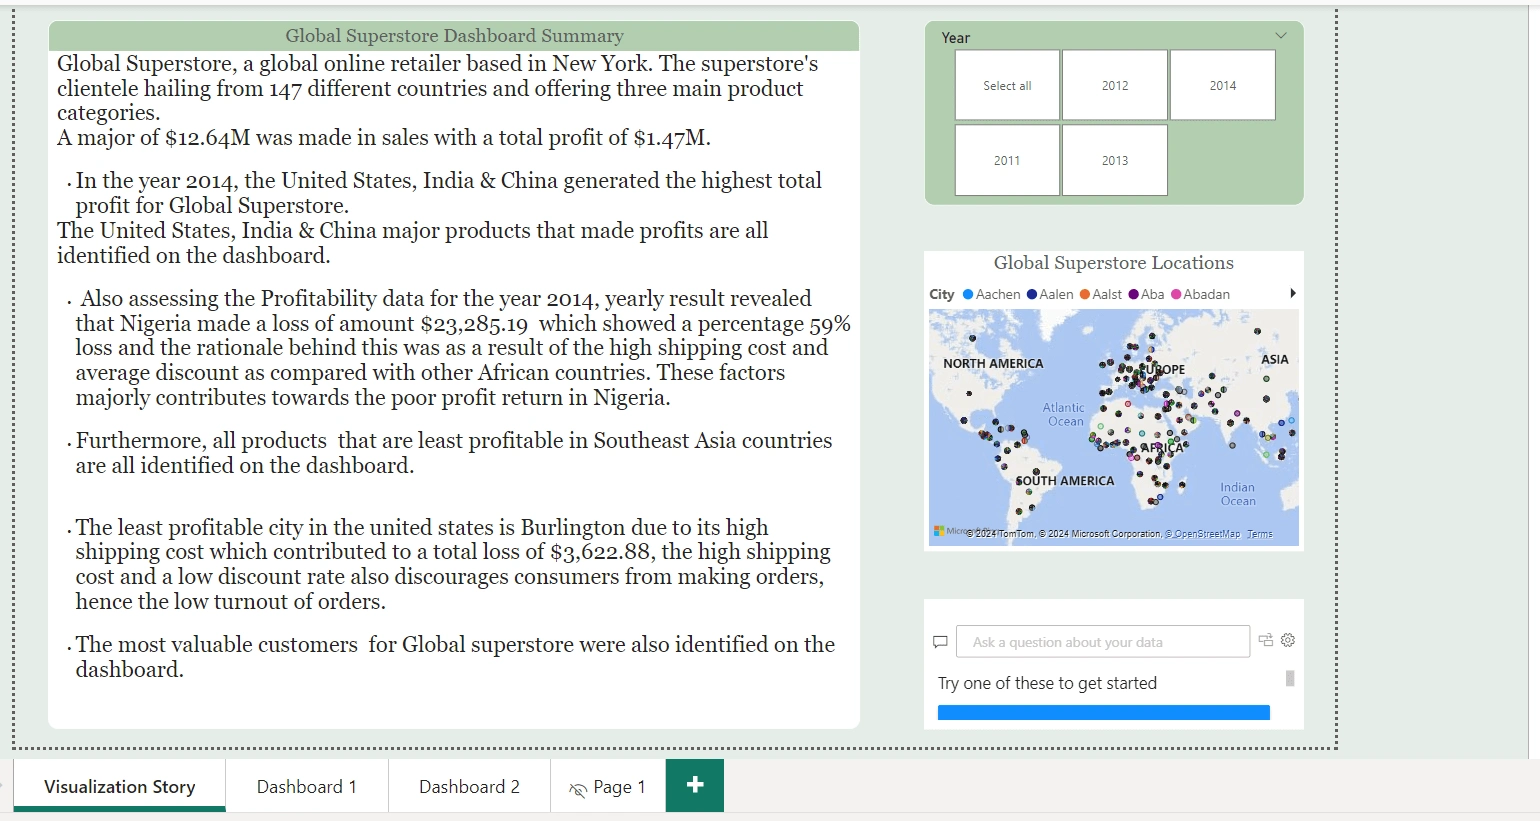
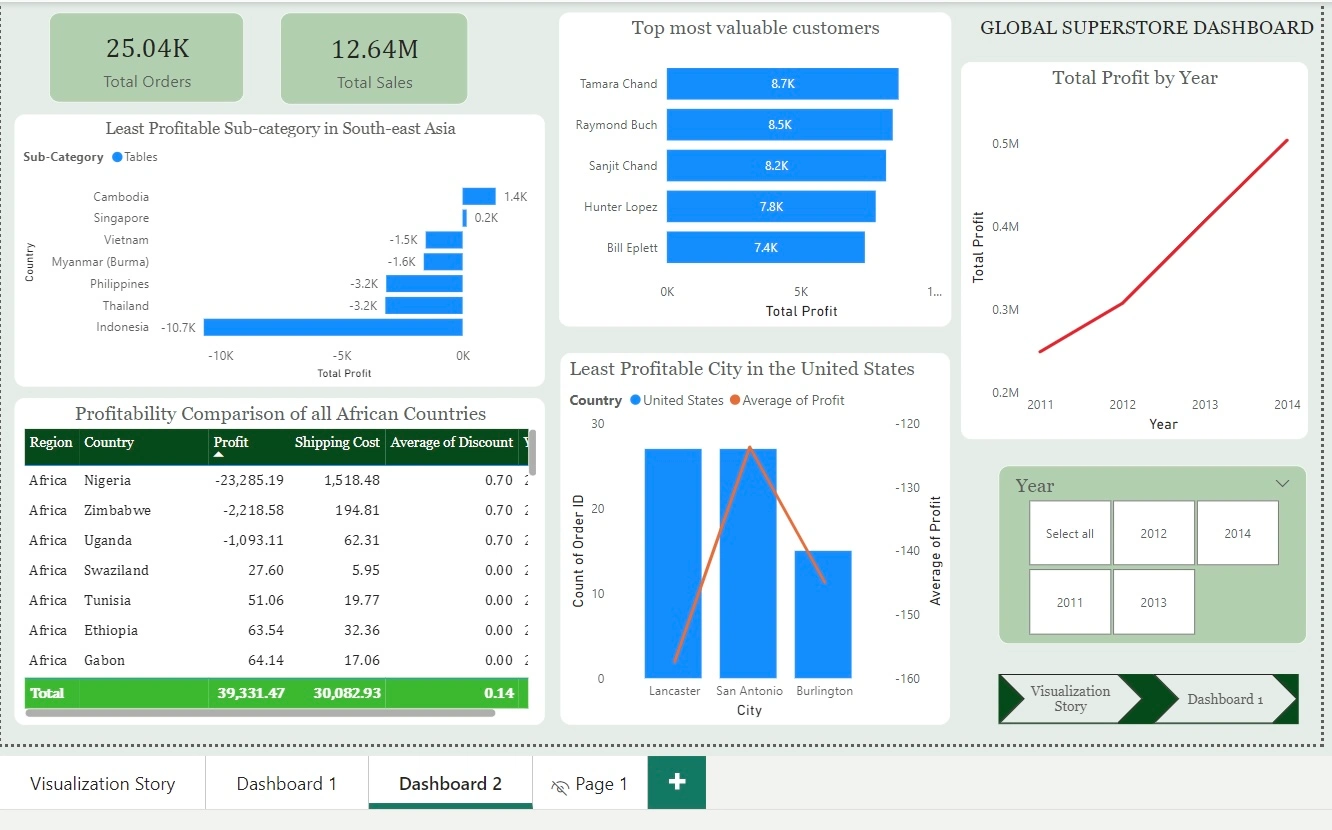
Problem Statement Question 1. a) What are the three countries that generated the highest total profit for Global Superstore in 2014? b) For each of these three countries, find the three products with the highest total profit. Specifically, what are the products’ names and the total profit for each product?
Question 2. a) Identify the 3 subcategories with the highest average shipping cost in the United States.
Question 3. a) Assess Nigeria’s profitability (i.e., total profit) for 2014. How does it compare to other African countries? b) What factors might be responsible for Nigeria’s poor performance? You might want to investigate shipping costs and the average discount as potential root causes.
Question 4. a) Identify the product subcategory that is the least profitable in Southeast Asia. Note: For this question, assume that Southeast Asia comprises Cambodia, Indonesia, Malaysia, Myanmar (Burma), the Philippines, Singapore, Thailand, and Vietnam. b) Is there a specific country i n Southeast Asia where Global Superstore should stop offering the subcategory identified in 4a?
Question 5. a) Which city is the least profitable (in terms of average profit) in the United States? For this analysis, discard the cities with less than 10 Orders. b) Why is this city’s average profit so low?
Question 6. a) Which product subcategory has the highest average profit in Australia?
Question 7. a)Who are the most valuable customers and what do they purchase?
Data Transformation/Cleaning Data was efficiently cleaned and transformed with Microsoft Excel and Power Query Editor of Power BI.Some of the applied steps included -Removing all outliers using conditional formatting. -Changing the data types and removing duplicates from the data.
Data Visualization Using Power BI, all problem statements were answered which is all included in the dashboard, the dashboard is interactive and user friendly. A visualization story was also developed and included on my dashboard.
Like this project
Posted Jul 31, 2024
Provided insightful solutions using a global e-commerce data to make data driven decisions for further expansion and advancement of goods and services.