Operation Management: Welco Lumber Company Analysis
Altaf Safi
Executive Summary
Welco Lumber Company is a manufacturing company that breaks down small and large logs to create cedar fencing materials. The company has operators that manually control the head rig. The company’s operators determine the different ways to break down the logs efficiently so they get the most products out of the process. Because 365 logs are broken down manually, the logs can go through errors. Gene, the operating manager of the company, wants to learn how productive the operators are in breaking down logs and whether they incur any errors in the process.
The case analysis explains the operators’ strengths and weaknesses. Throughout the analysis, operators worked better on small logs because they provided greater amounts of slabs and cants. Moreover, three pivot tables, one pie chart, one histogram, and one measure of the center was used to analyze the company’s dataset. Sid cut most of the small logs correctly, while April was good at cutting large logs correctly. About 50 percent of the logs were incorrectly cut, while the other 50 percent of the logs were correctly cut with no errors.
Additionally, several small logs went through the Off Center Cant error. April was causing the majority of the Off Center Cant errors. However, when large logs were cut down, the wrong position of the cant did not affect large logs. Small logs were easier to cut down for all operators. As the operators cut logs in an efficient and correct way, more quantities would be available for sale, thereby increasing profits by $735.14.
For recommendations, the operating manager, Gene, should monitor the company’s log inventory on a weekly basis to avoid theft and business losses. The company should buy more small logs as it works best to be broken down manually by operators. Gene should assign the operators tasks based on their strengths in a particular type of a log. Lastly, the company should invest in an automated head rig machinery system that will reduce the amount of errors from happening during the breakdown process. The machinery system will reduce the amount of labor needed in the company and save time, leading to lower operating costs and more profits.
Case Analysis
Background
Welco Lumber Company has about 160 employees that help manufacture cedar fencing materials at the company’s Naples and Idaho facilities. The company buys cedar logs from open markets to create as much cedar fence boards as possible. Moreover, the company uses a head rig, which is a large saw that breaks down the logs into slabs and cants. There are two different sizes of logs that provide different amounts of cants and slabs as they are broken down by the head rig. Fence board products are created from both, slabs and cants.
Welco Lumber Company has three operators; April, Sid, and Jim. All three operators manually control the head rig and determine how to efficiently break down 365 logs and obtain maximum amounts of slabs and cants. April, Sid and Jim control the way the cants are properly centered and broken down so that optimal quantities are produced from them. Additionally, the company wants to perform a descriptive analysis to determine its lost profits and evaluate the differences in performance among the three operators. In this case analysis, numerical measures are used to describe the company’s data and determine whether the operators perform better on small logs or large logs.
Differences Among the Operators
Welco Lumber Company has a time series dataset, since information was recorded at specific time intervals, from November 6, 2006 through November 21, 2006. The log number, operator, large and small log size, correct cut, and error category are the qualitative factors of the dataset. The log size, actual value, potential gain, and potential value are the quantitative factors of the dataset. To determine the performance of large and small logs, a pivot table was created to break down the categories. The data shows a record of 362 logs. The data of three logs are missing. Table 1 below shows how well the operators performed in cutting large and small logs correctly. Sid cut the highest amount of logs in the correct manner, compared to April and Jim. In other words, Sid cut a total of 92 logs correctly, whereas, April cut 57 logs correctly and Jim cut 32 logs correctly, all of which are less than Sid’s correct cuts.
Additionally, Table 1 shows that all three operators cut more small logs correctly and better than large logs. The operators tend to be more productive in cutting small logs because they are making more quantities from the small logs in the same amount of time. Moreover, Sid cut most of the small logs correctly of about 89 logs, whereas, April cut most of the large logs correctly of about 15 logs. However, April and Jim have performed poorly in cutting small logs. Overall, all three of the operators do a better job in cutting small logs.
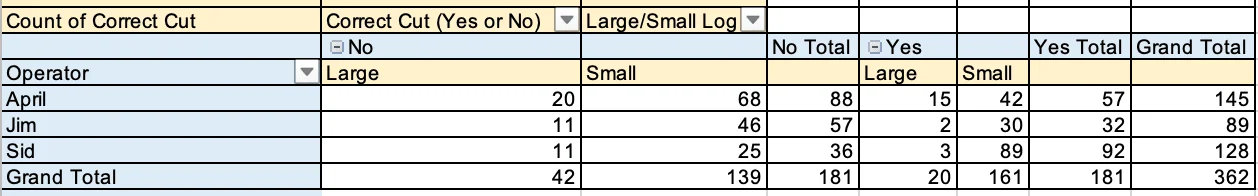
Table 1: Count of Correct Cut
Next, the Pie Chart below demonstrates the number of times an error occurred and what type of error happened while cutting the logs. About 7.18 percent of the 362 logs went through an Excessive Log Breakdown error as they were cut incorrectly. Furthermore, 8.56 percent of the logs had a Reduced Value Cut error as logs were cut incorrectly. About 33.98 percent of the logs had an Off Center Cant error where cants were not properly centered for a cut. On the other hand, 50.28 percent of 362 logs had no error since they were cut correctly. The count of error category pie chart summarizes that 50.28 percent of the logs had no errors, while the other 49.72 percent went through a variety of errors during the breakdown process. Because about 49.72 percent of the logs were processed with different types of errors, the company lost $735.14 in potential profits. The potential profit was obtained from the difference between the Potential value of each log less the Actual value of it.
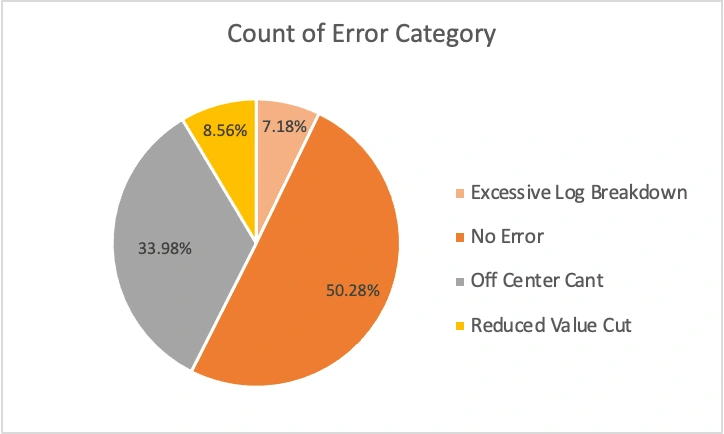
Pie Chart: Count of Error Category
Additionally, the Off Center Cant error is the highest repeated error in the breakdown process since it happened 123 times. All three of the operators cut most of the small logs incorrectly due to errors caused by Off Center Cants. Table 2 below shows that Off Center Cant errors are affecting several small logs. For instance, April experienced 40 errors and Sid experienced 22 errors when cants were off the center. Due to high errors, each small log that was incorrectly cut, was not producing optimal profits. As cants were off the center, large logs were not affected at all. Furthermore, April was making most of the errors when processing the logs. April did not properly center the cants to make optimal quantities of finished products. Overall, if the company buys an automated machinery system to solve the problem of Off Center Cant errors, it will increase its productivity, time, and profits. The new machinery system will also reduce the amount of errors.
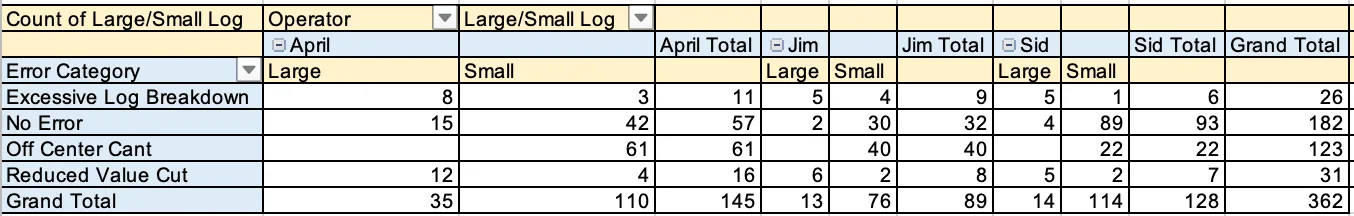
Table 2: Count of Large or Small Log
Determining the Potential Values of Finished Products
According to Table 3 below, the potential value shows the price ranges of the finished products if logs were cut in an optimal manner without making errors. In a situation where all logs are broken down in an efficient way for maximum production, small logs are predicted to bring greater value to the company. When small logs were broken down, they provided 300 slabs and cants, whereas large logs provided 62 slabs and cants, which was lower than small logs production. Moreover, small logs are considered to be more efficient in its production and manufacturing process. As small logs are easier to be broken down into slabs and cants, they reduce the manufacturing costs and help the company sell products at profitable prices from about eight dollars to forty eight dollars. On the other hand, when large logs are broken down, they provide lower quantities of slabs and cants. Overall, large logs appear to be more time consuming in its production process and more costly for purchase.
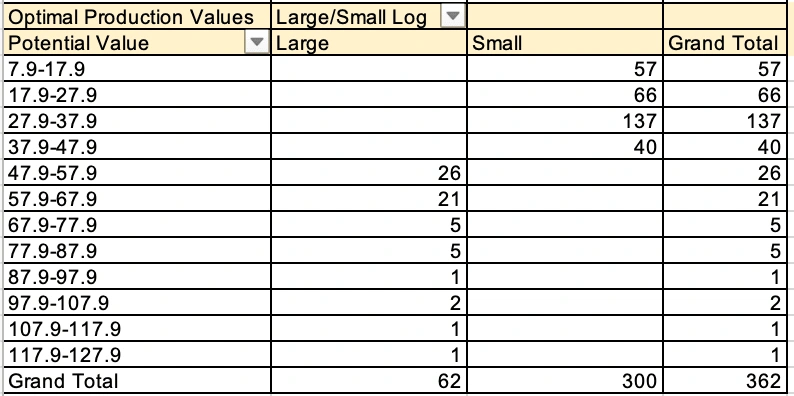
Table 3: Optimal Production Values
Furthermore, the Histogram below shows the relationship between the potential monetary value of a log versus large and small log count. The histogram shows that there is a right-skewed distribution and a positive relationship between potential value and large and small log count. The histogram is right skewed because there are extreme values on the right side of the graph, meaning that large logs are expensive for purchase since they are broken down into fewer slabs and cants. Also, small logs have broken down into significant amounts of slabs and cants. This maximum production helps the company to set average and profitable prices from about $27.9 to $37.9.
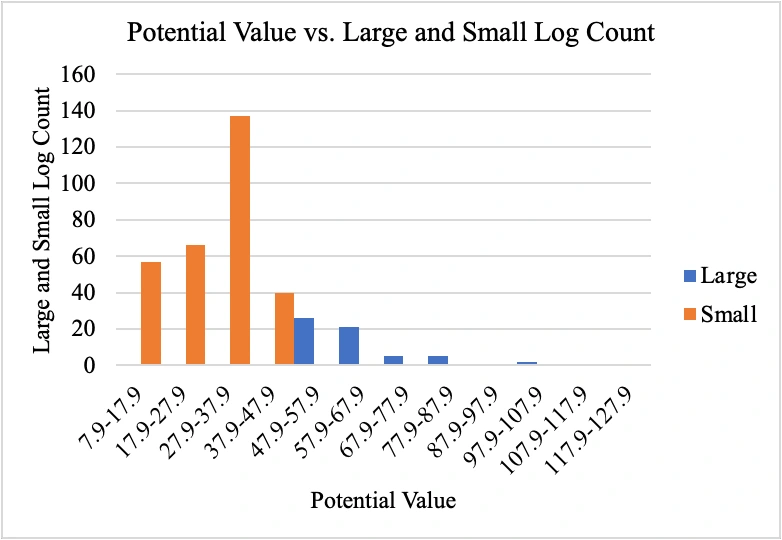
Histogram: Potential Value vs. Large and Small Log Count
Lastly, Table 4 below shows the projected profits on logs that experienced any type of error. If both, large and small logs, were cut in efficient ways without errors, they would have made an average profit of four dollars for every sale of a log. Table 4 also shows that about 180 logs were incorrectly cut and the logs experienced a type of error throughout the manufacturing process.
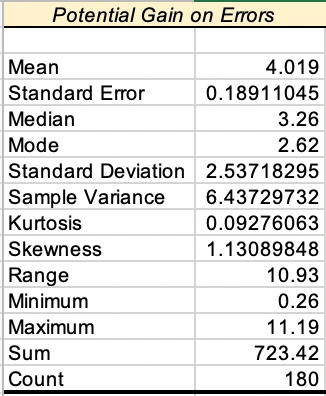
Table 4: Measures of Central Tendency
Recommendations
Gene Denning, manager of Welco Lumber Company, should check the company’s log inventory on a weekly basis to prevent any theft and loss in the business. Gene’s intent was to determine the performance of 365 logs in the break down process. However, there were only 362 logs recorded in the dataset, meaning three logs were missing. If the three logs are lost, Gene should count them towards losses. Moreover, Sid has been productive in cutting the most logs in the correct way. Sid should get promoted to a higher position in the company because he can train other operators on how to correctly cut logs in a fast paced environment.
Furthermore, the company should buy more of small logs. Operators should manually break down small logs because they provide greater quantities of slabs and cants. All three of the operators have been cutting small logs in an optimal way than large logs. Gene should assess each operator’s strengths and weaknesses and assign tasks accordingly. Gene should assign Sid to cut small logs because he can cut them correctly. On the other hand, April should cut large logs because she performs better on large logs.
Often times, cants are aligned off center when small logs are broken down. To solve the problem of Off Center Cant error, the company should invest in an automated machinery system that helps cants to center its position with correct measurements so that all small logs are cut in a standard size. This way the company can then reduce the amount of operators in facility and save time, leading to lower operating costs. On the other hand, the company can still make profits as it continues to break down large logs in an off center cant circumstance. In other words, the Off Center Cant error does not affect large logs.
When logs are cut efficiently, maximum amounts of products can be gained from the logs. If the logs do not make any errors, the company would make an average profit of four dollars for the sale of every log in the wholesale market. The company would have made a profit of $735.14 in total. Gene should buy more of small logs because it has brought greater value to the company even when there were errors throughout the cutting process. When small logs are broken down, they provide 300 slabs and cants, whereas large logs provide 62 slabs and cants. Lastly, cutting large logs can be time consuming, expensive, and require more labor to complete the manufacturing process.
Like this project
Posted Dec 13, 2023
Welco Lumber Company, with a 50% error rate in manual log breakdown, should invest in automated machinery for efficiency and cost savings.