Dynamic Charts in Canva

Charlotte Chan
Problem
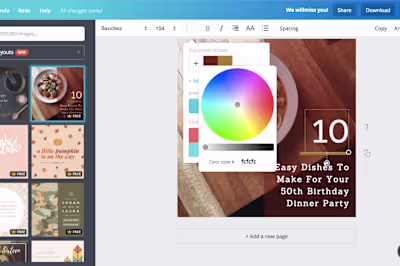
One of the most requested features for Canva was the ability to create nice graphs. User's wanted personalized graphs that represented their data, rather than basic vector elements of bar charts and pie charts. Designing this feature took months of planning because it was an entirely new interaction within the Canva platform.
• How many features should we introduce at first?
• How much customization is necessary?
• Do we have titles? Do we have labels?
• What functions should be in the toolbar?
• How do we import and update data?
Solution
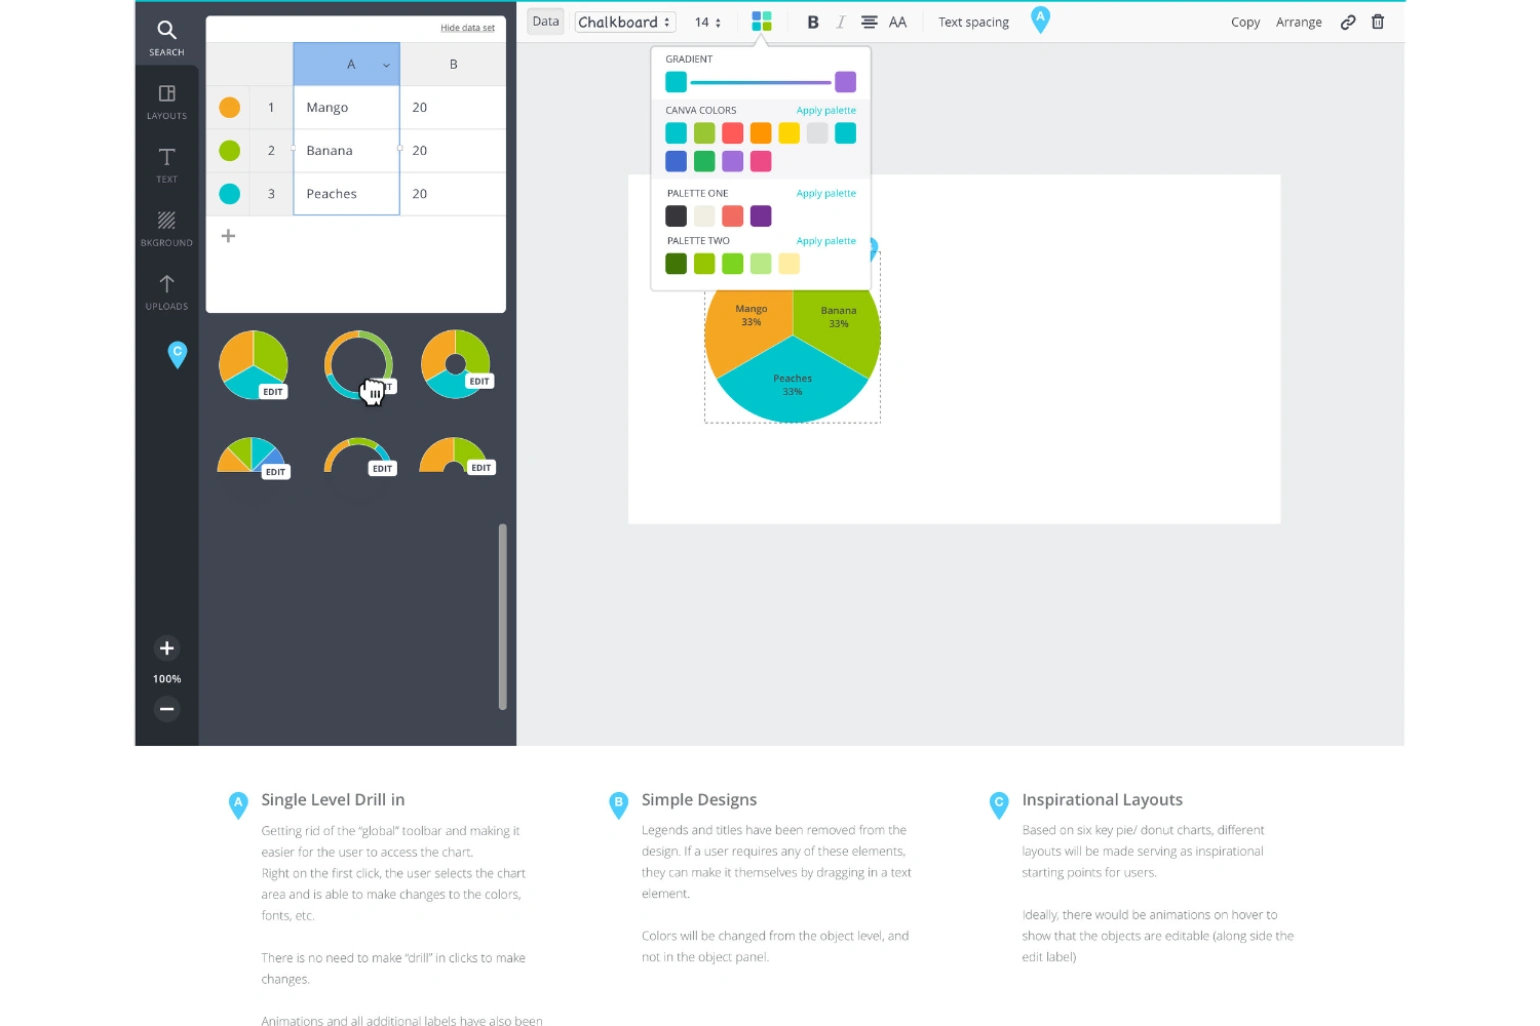
I worked on the flow for the pie charts. We decided to launch first with bar charts, pie charts, and donuts. This feature was released in December 2016. We removed all complexities and implemented the basic chart. Any additional elements could be customized by the user themselves. This gave the design team much more flexibility, and helped reduce clutter on the toolbar.
Like this project
Posted Jan 27, 2021
Likes
0
Views
22
Tags