Windows System Utility: Memory Monitor & Optimizer

Yaroslav Kuzmin


Windows Tray Memory
A Windows desktop application for monitoring RAM usage, identifying memory-heavy processes, and configuring cleanup behavior from the system tray.
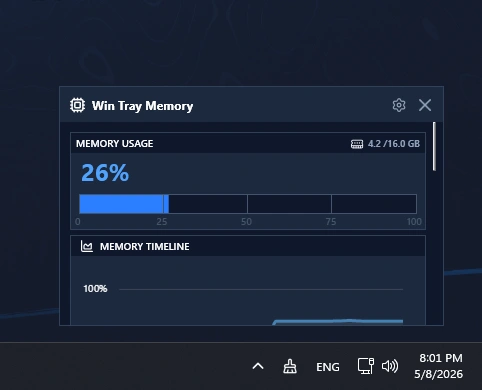
Windows Tray Memory main dashboard
The Goal
The app needed to turn system-memory data into something users can understand quickly: what is using RAM, whether the system is under pressure, and which actions are safe to take. It also needed to keep advanced controls available without making the daily workflow feel like Task Manager.
What I Built
Real-time RAM overview with usage, available memory, and status indicators
Memory timeline, breakdown, and pressure visualizations
A focused list of memory-heavy processes with safety categories
Manual and automatic cleanup controls
Configurable monitoring, process rules, startup behavior, and cleanup options
Tray-first Windows desktop experience built with C#, WPF, SQLite, EF Core, and MVVM
Showing the Current State of Memory
The primary dashboard gives users a clear view of total memory usage and available RAM before they need to make a decision. It keeps the most important system information visible in one place.
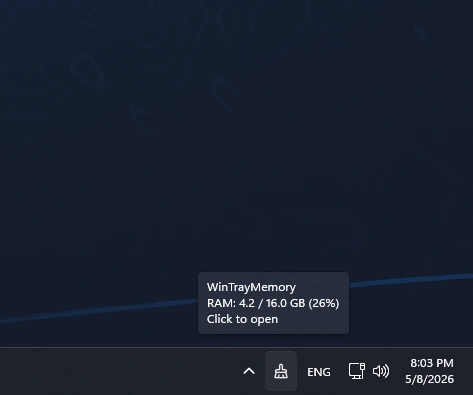
Current memory usage
Making Changes Over Time Visible
The timeline visualizes memory usage over the last minute. This helps users see whether a spike is temporary or whether memory pressure is continuing to build.
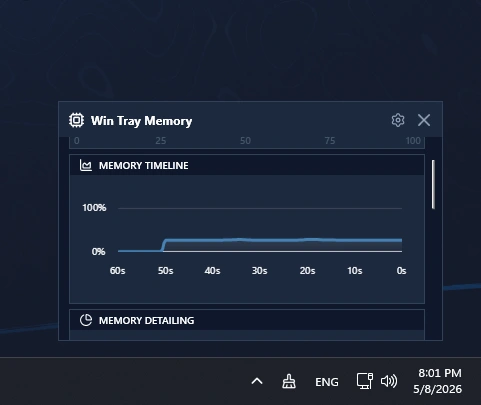
Memory usage timeline
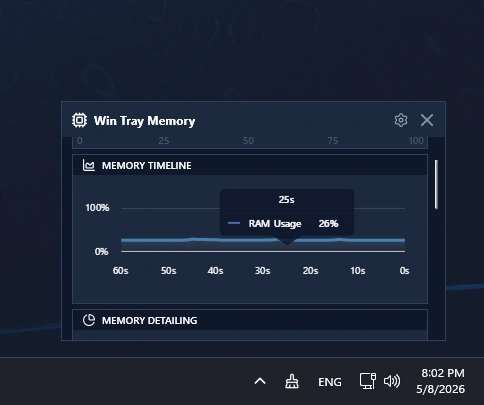
Memory usage timeline example
Explaining Memory Pressure
The pressure gauge combines commit percentage, hard faults, and a readable status so the user can quickly understand whether the machine is in a Good, Warning, or Critical state.
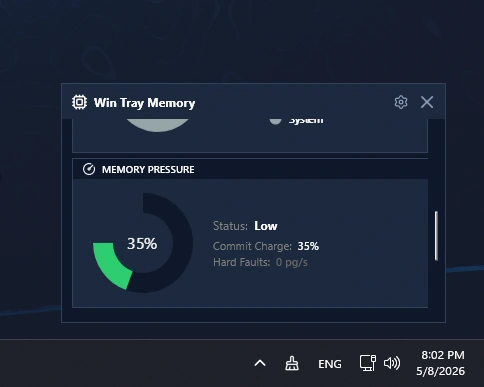
Memory pressure
Breaking Down Where Memory Is Used
The detail view separates application memory, shared resources, and system memory. It turns a single RAM percentage into a more useful explanation of what is happening on the machine.
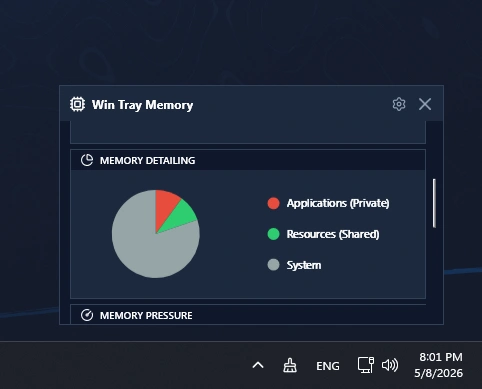
Memory detail
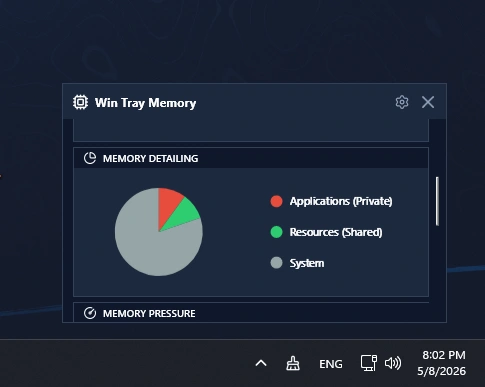
Memory detail example
Bringing Heavy Processes Into Focus
The process list highlights the most memory-intensive processes instead of displaying everything at once. Safe, Warning, and System categories add a guardrail before a user closes a process.
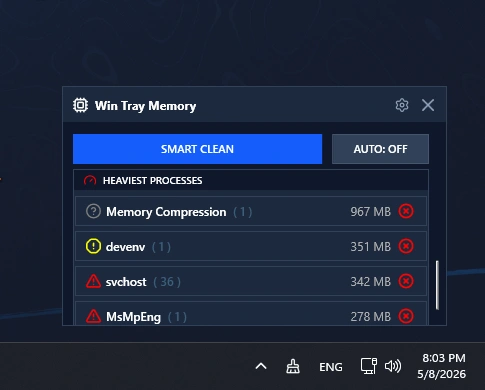
Heavy processes and actions
Keeping Settings Clear and Accessible
The settings area groups the app's behavior into an accessible control surface, giving users a place to adjust how monitoring and cleanup work without crowding the main dashboard.
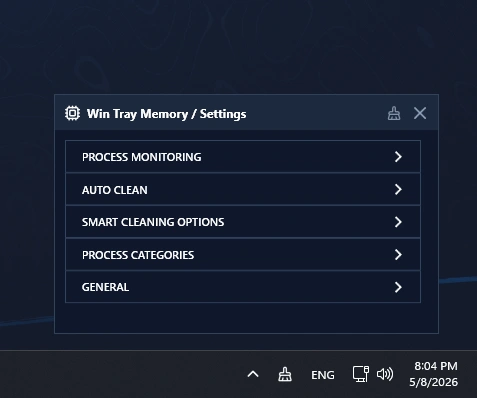
Settings page overview
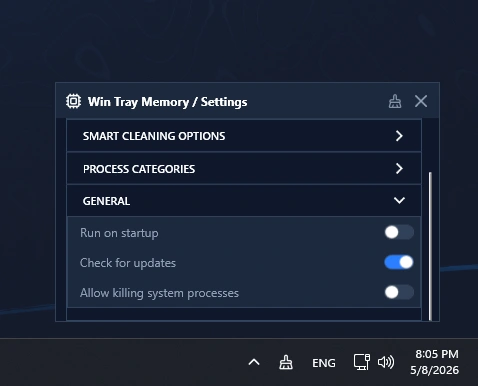
General settings
Configuring Process Monitoring
Users can control the threshold and behavior used to identify heavy processes, allowing the monitor to match different hardware and workflows.
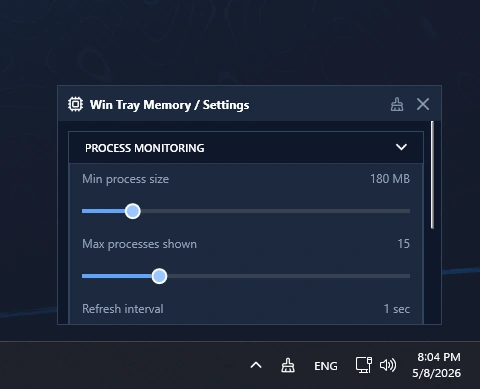
Process monitoring settings
Adding Safety Rules for Processes
Custom process categories let users define what is safe to close, what requires confirmation, and what should be protected as a system process.
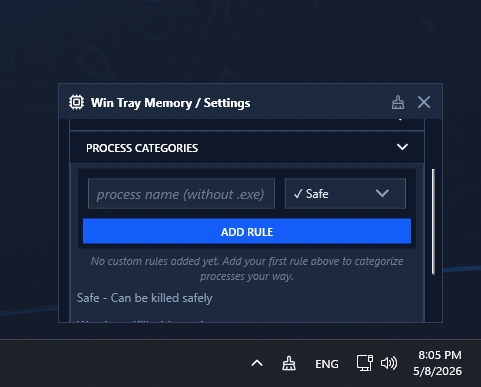
Process category settings
Automating Cleanup With User Control
The cleanup settings let users choose when automatic cleanup should run and which options are used. The app can stay in the tray while still keeping those decisions visible and adjustable.
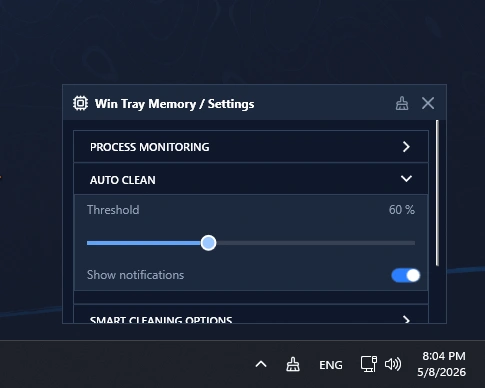
Automatic cleanup settings
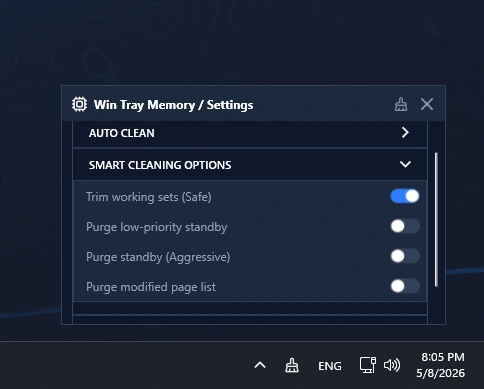
Smart cleaning options
Source Code
Personal project, open-source.
Like this project
Posted Aug 6, 2026
Windows desktop utility for real-time RAM monitoring, process safety controls, and configurable memory cleanup from the system tray.