The project delivered a professional,
Ehab Botros
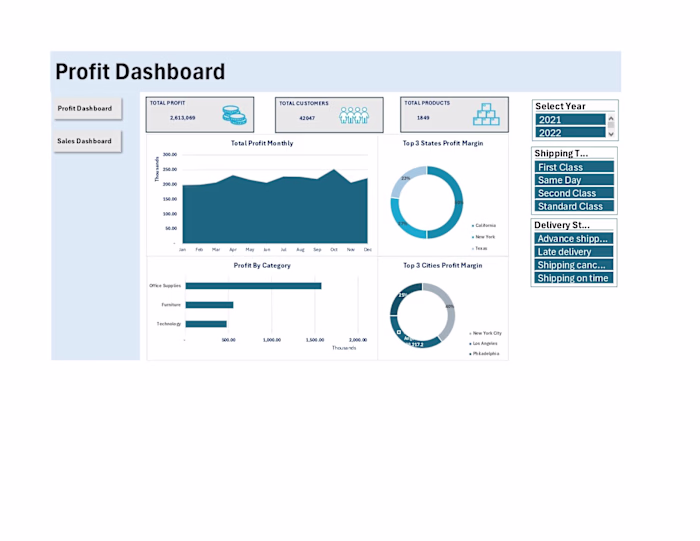
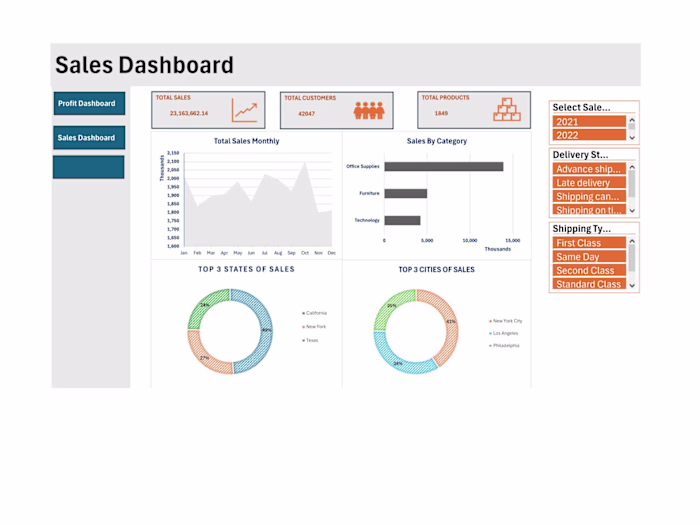
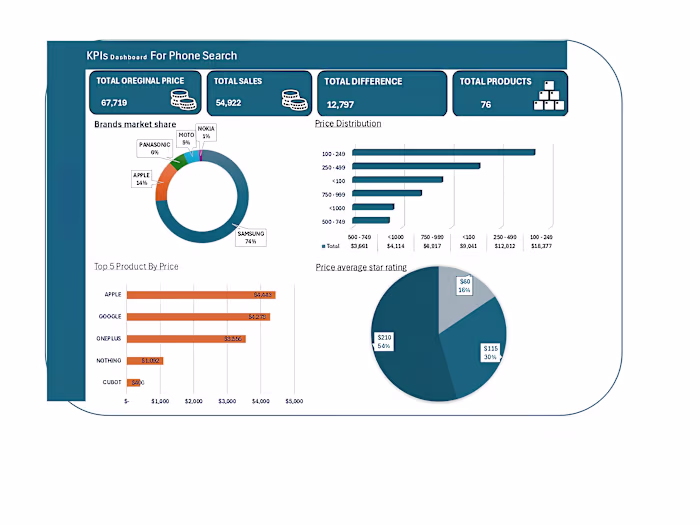
The project delivered a professional, multi-panel dashboard with line graphs, bar charts, and pie charts, enabling stakeholders to quickly assess growth, customer behavior, and operational efficiency. This visualization improved decision-making by providing clarity on sales performance, customer activity, and revenue consistency.
Like this project
Posted Apr 4, 2026
The project delivered a professional, multi-panel dashboard with line graphs, bar charts, and pie charts, enabling stakeholders to quickly assess growth, cus...