Built with Framer
TideGrid Port Operations Desktop App

Artis Lutkovskis


TideGrid – Port Operations Desktop App
Client Pain
Port operators tracked each day across separate systems. Berth plans were in one tool, crane logs in another, and vessel ETAs and weather forecasts somewhere else. Because there was no shared picture, a late vessel, an idle crane or a wind spike was usually noticed only after it had already cost time. Every shift started with calls and spreadsheets.
About Project
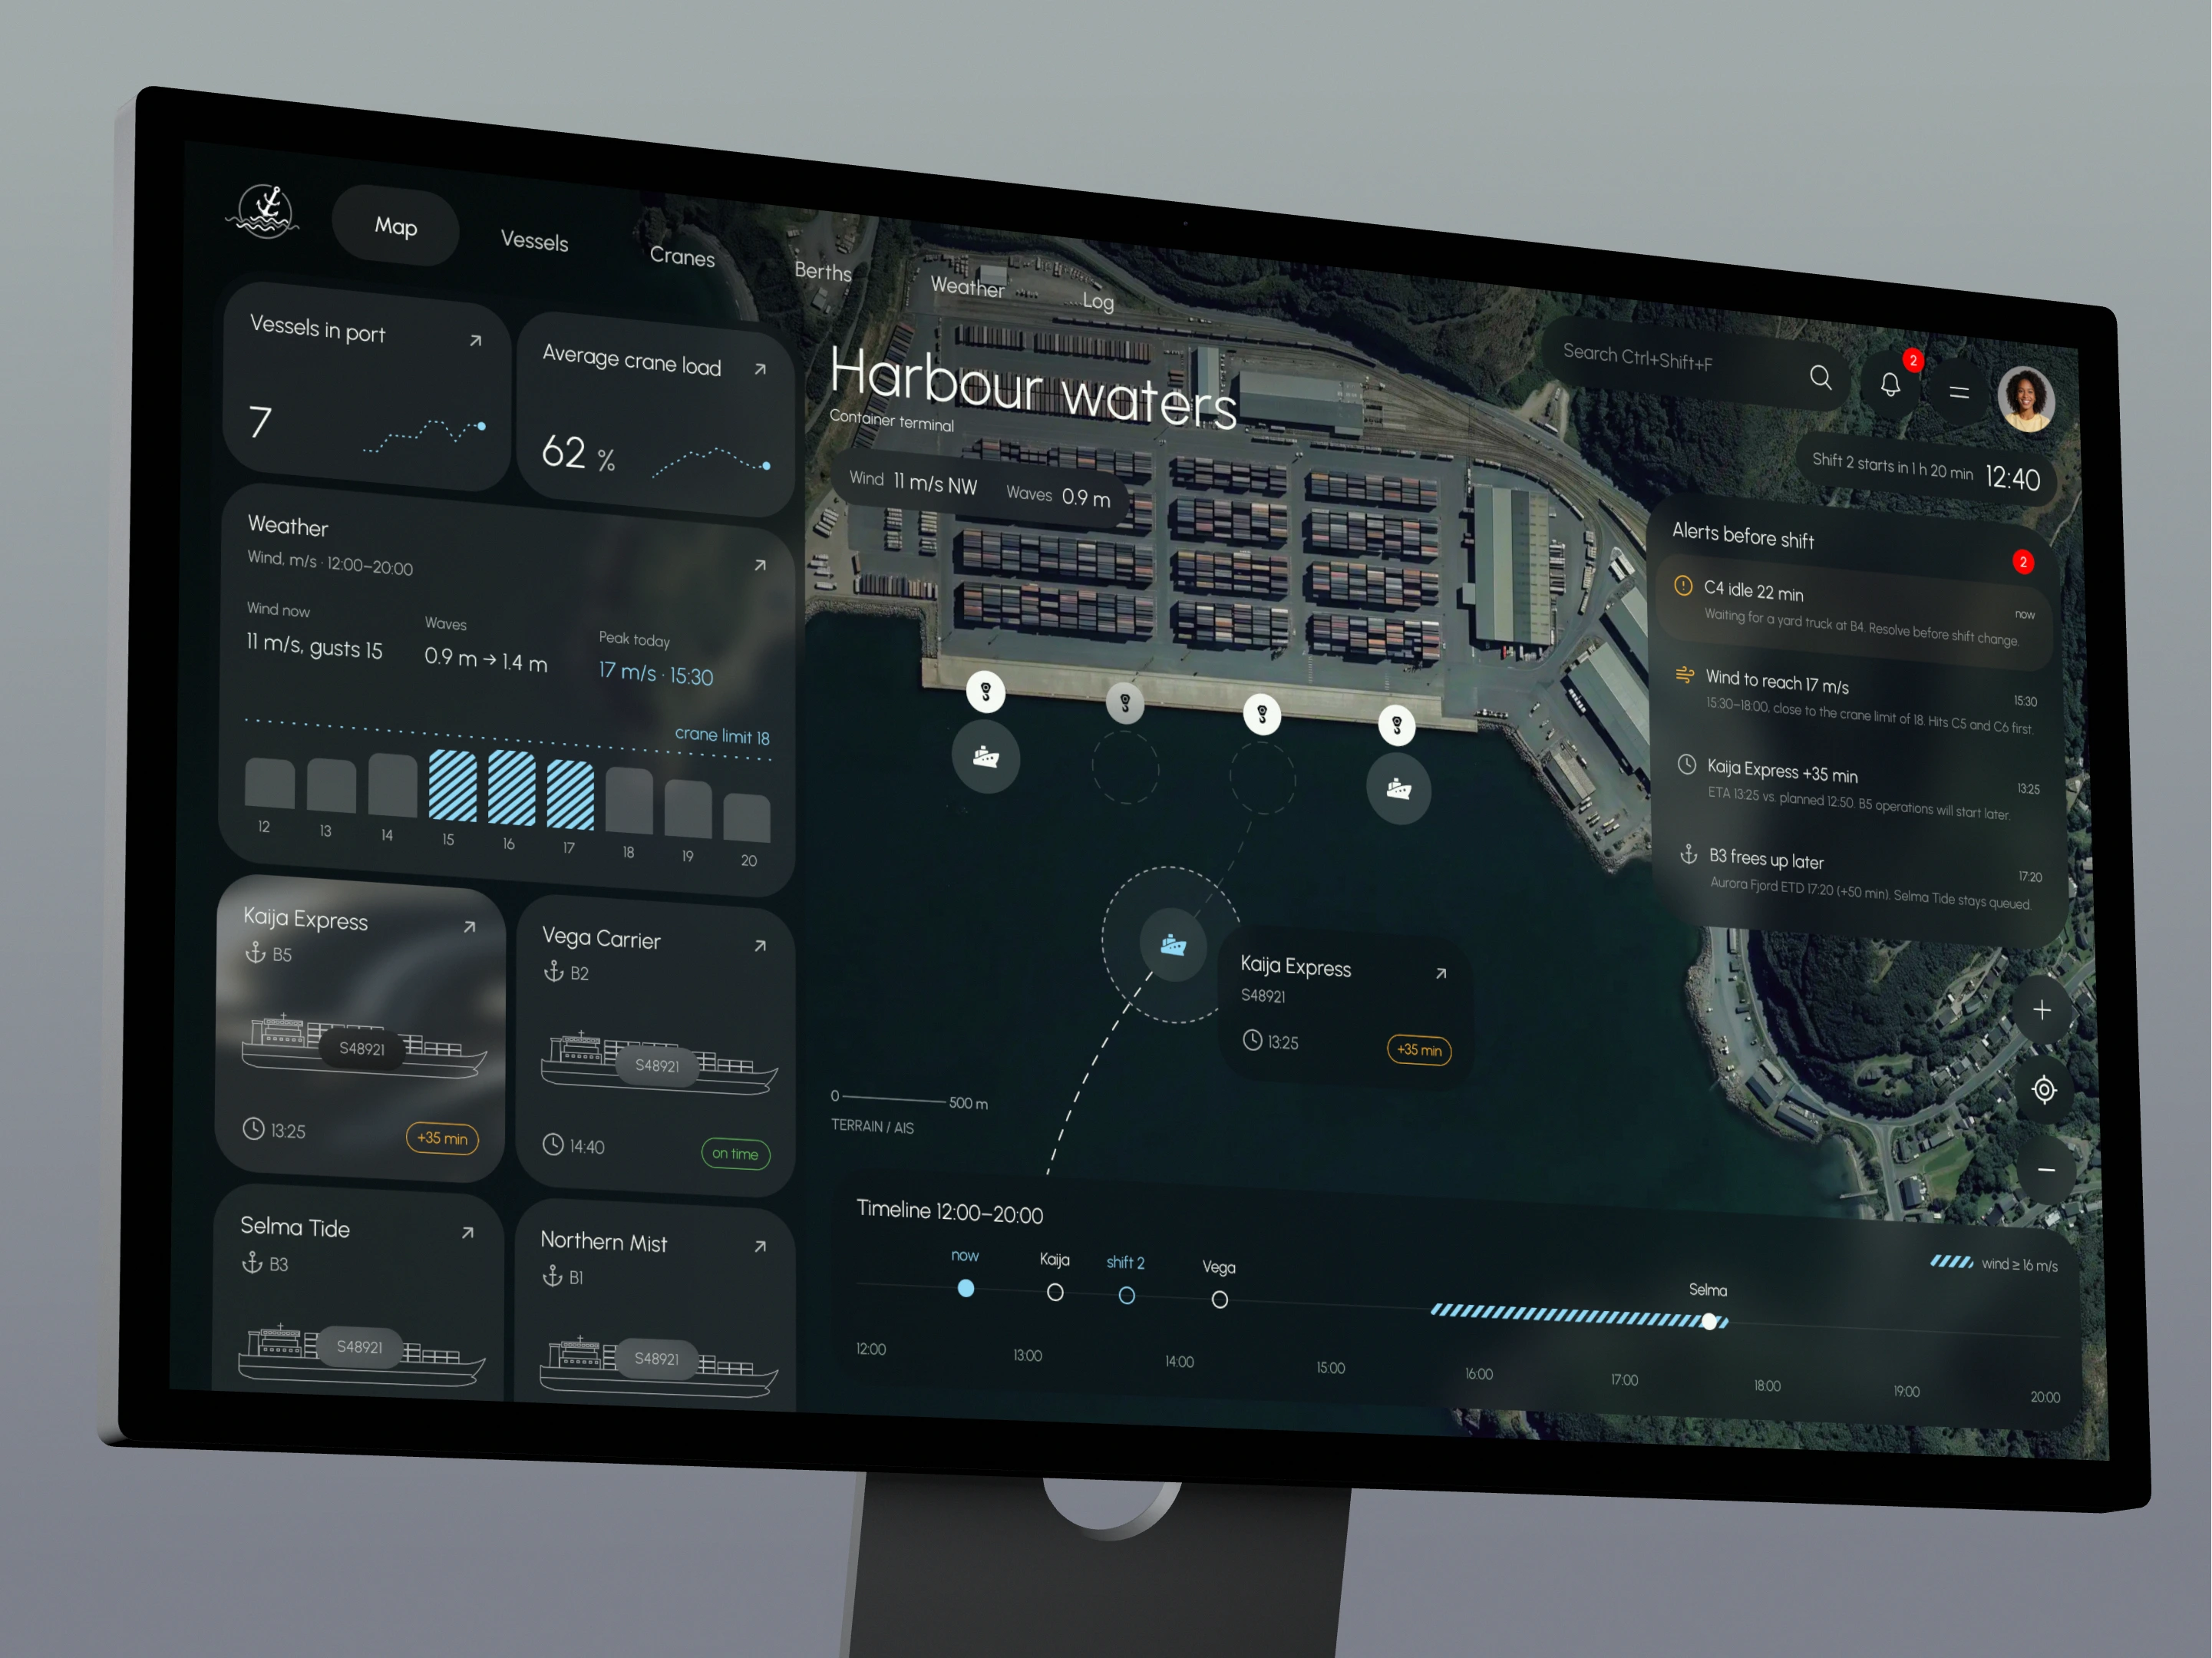
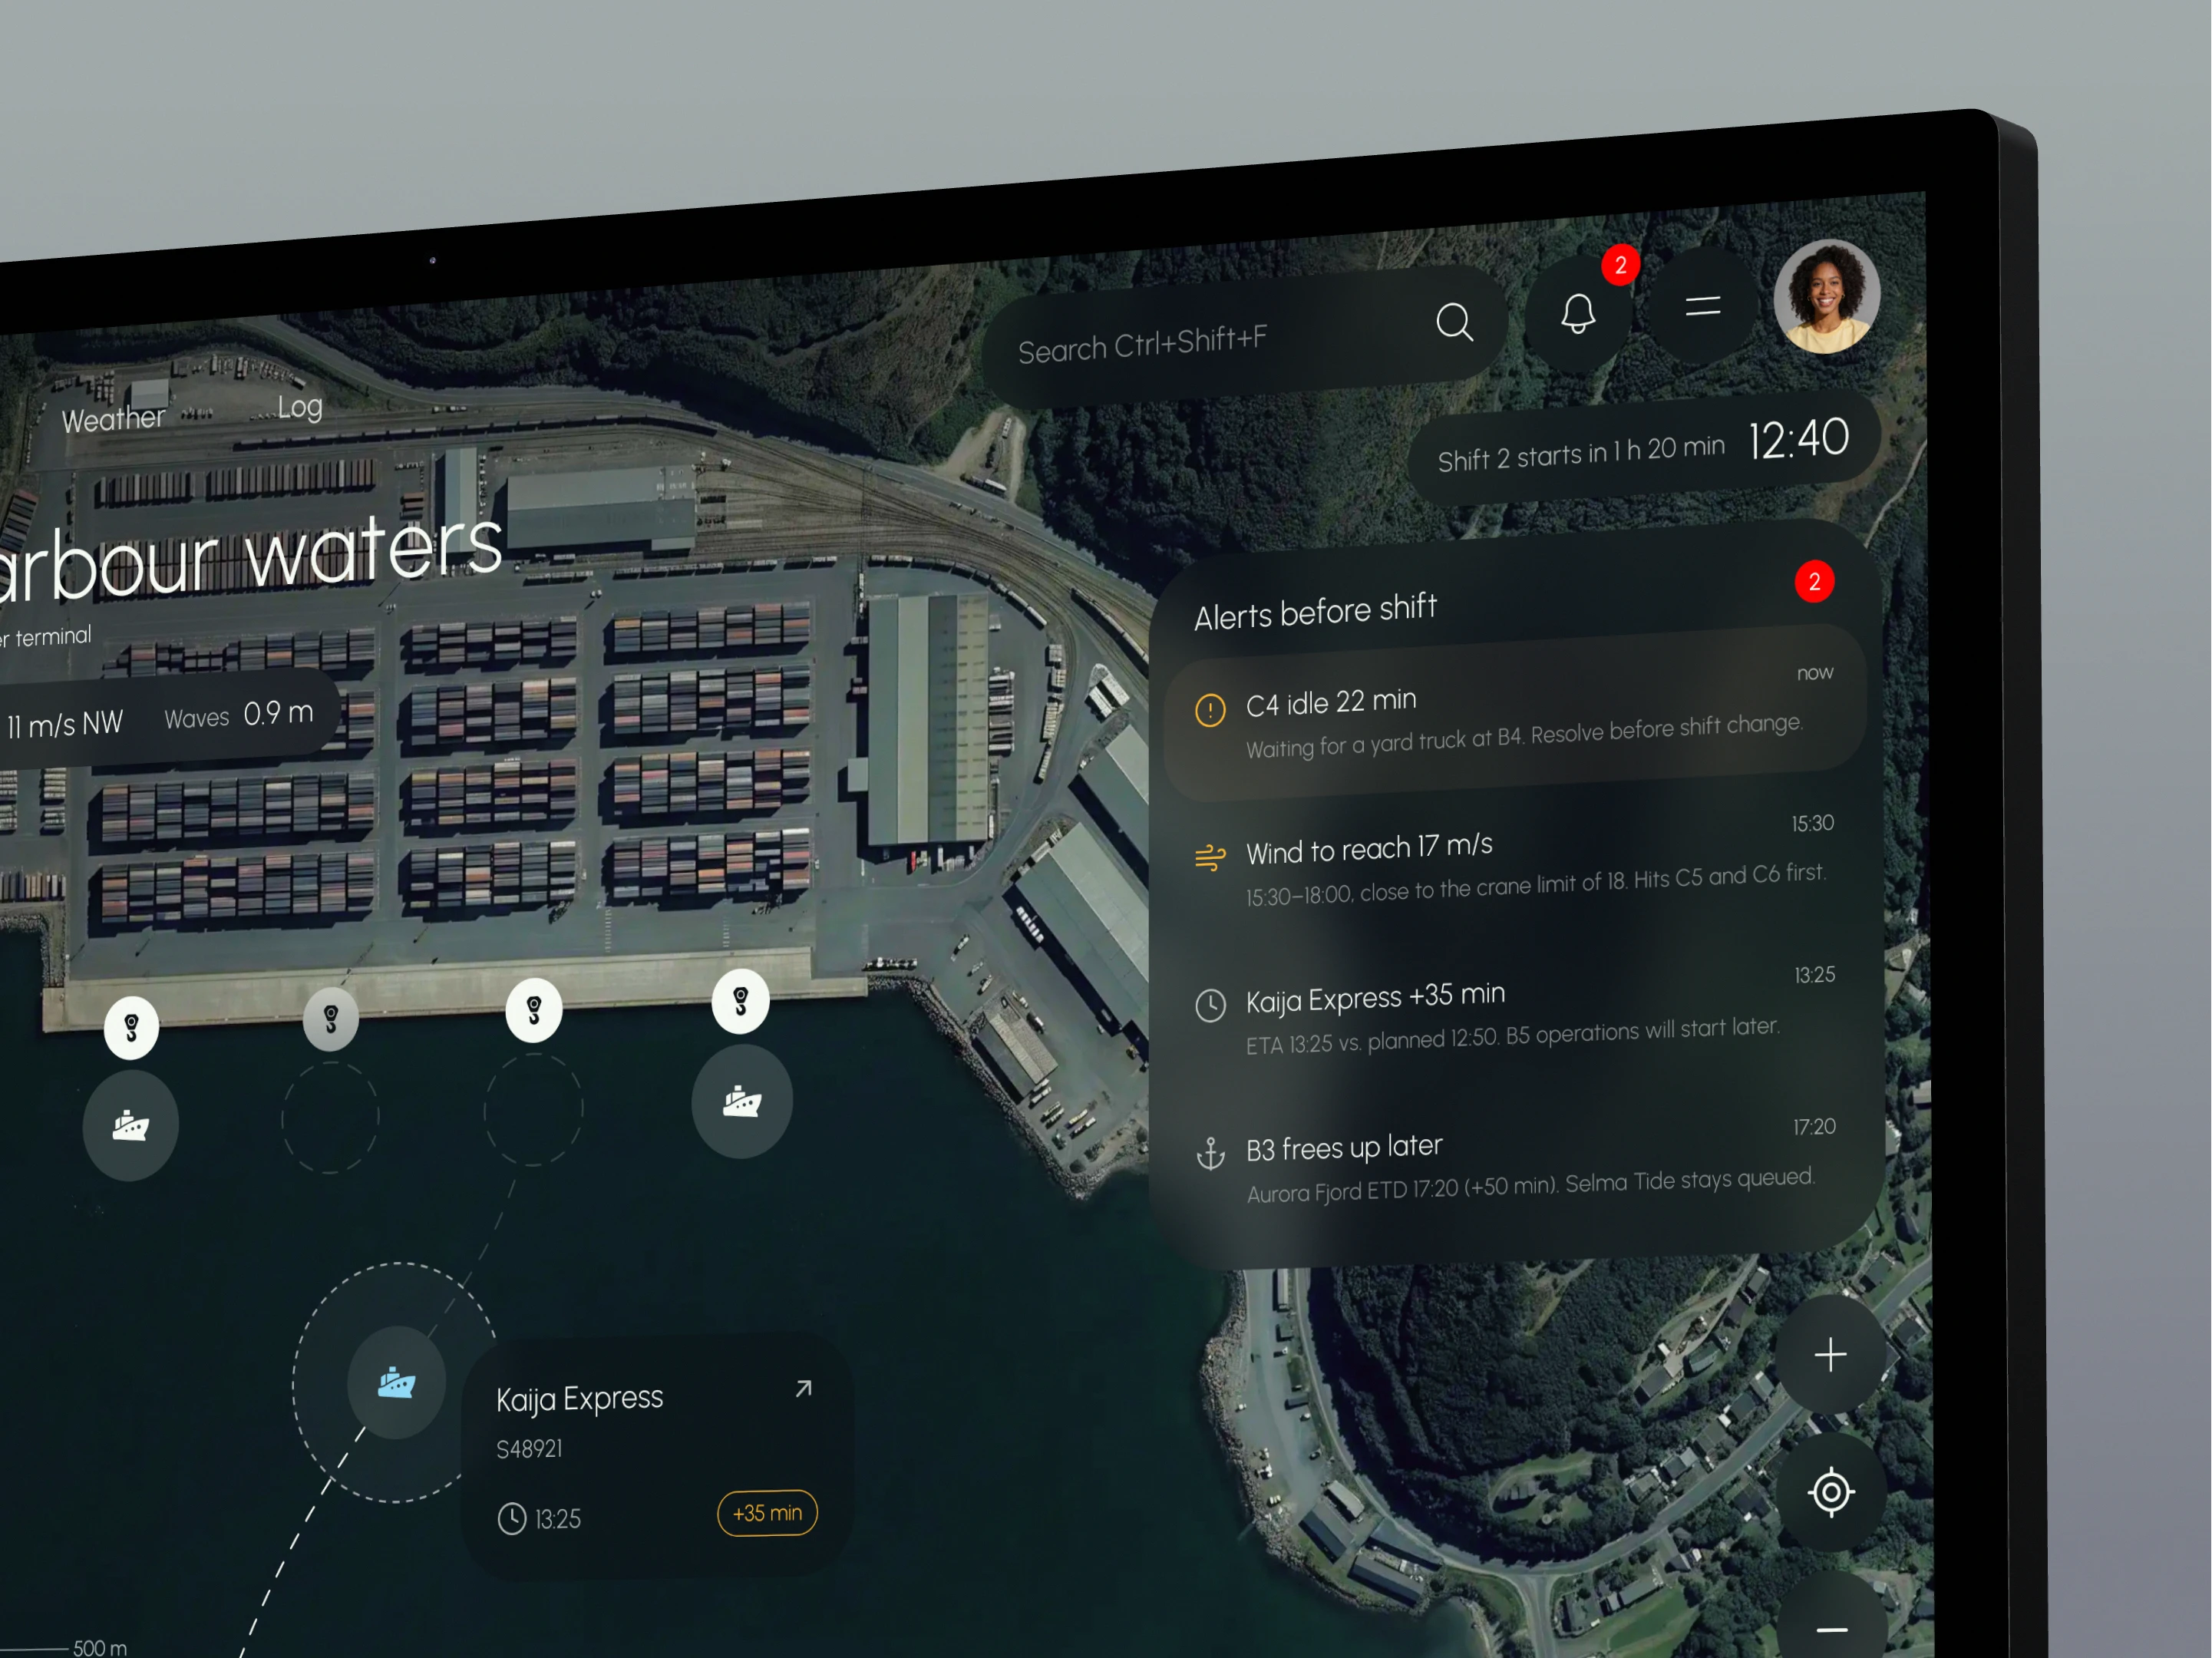
TideGrid is a desktop console that gives port operators one view of the whole port. Vessels, cranes and berths share a single map, next to the weather that affects them, so the team can plan the shift, catch conflicts early and act with full context. A companion mobile app gives foremen on the quay the same picture. No new hardware is needed: data comes from vessel AIS, existing crane systems and sensors.
Business Task to Solve
The task was to bring berth plans, crane activity, vessel ETAs and weather into one operational view without new equipment or extra steps for the team. Operators needed to see three things at a glance: what is happening now, what will happen in the next hours, and what needs attention before the shift starts.
Project Timeline & Process
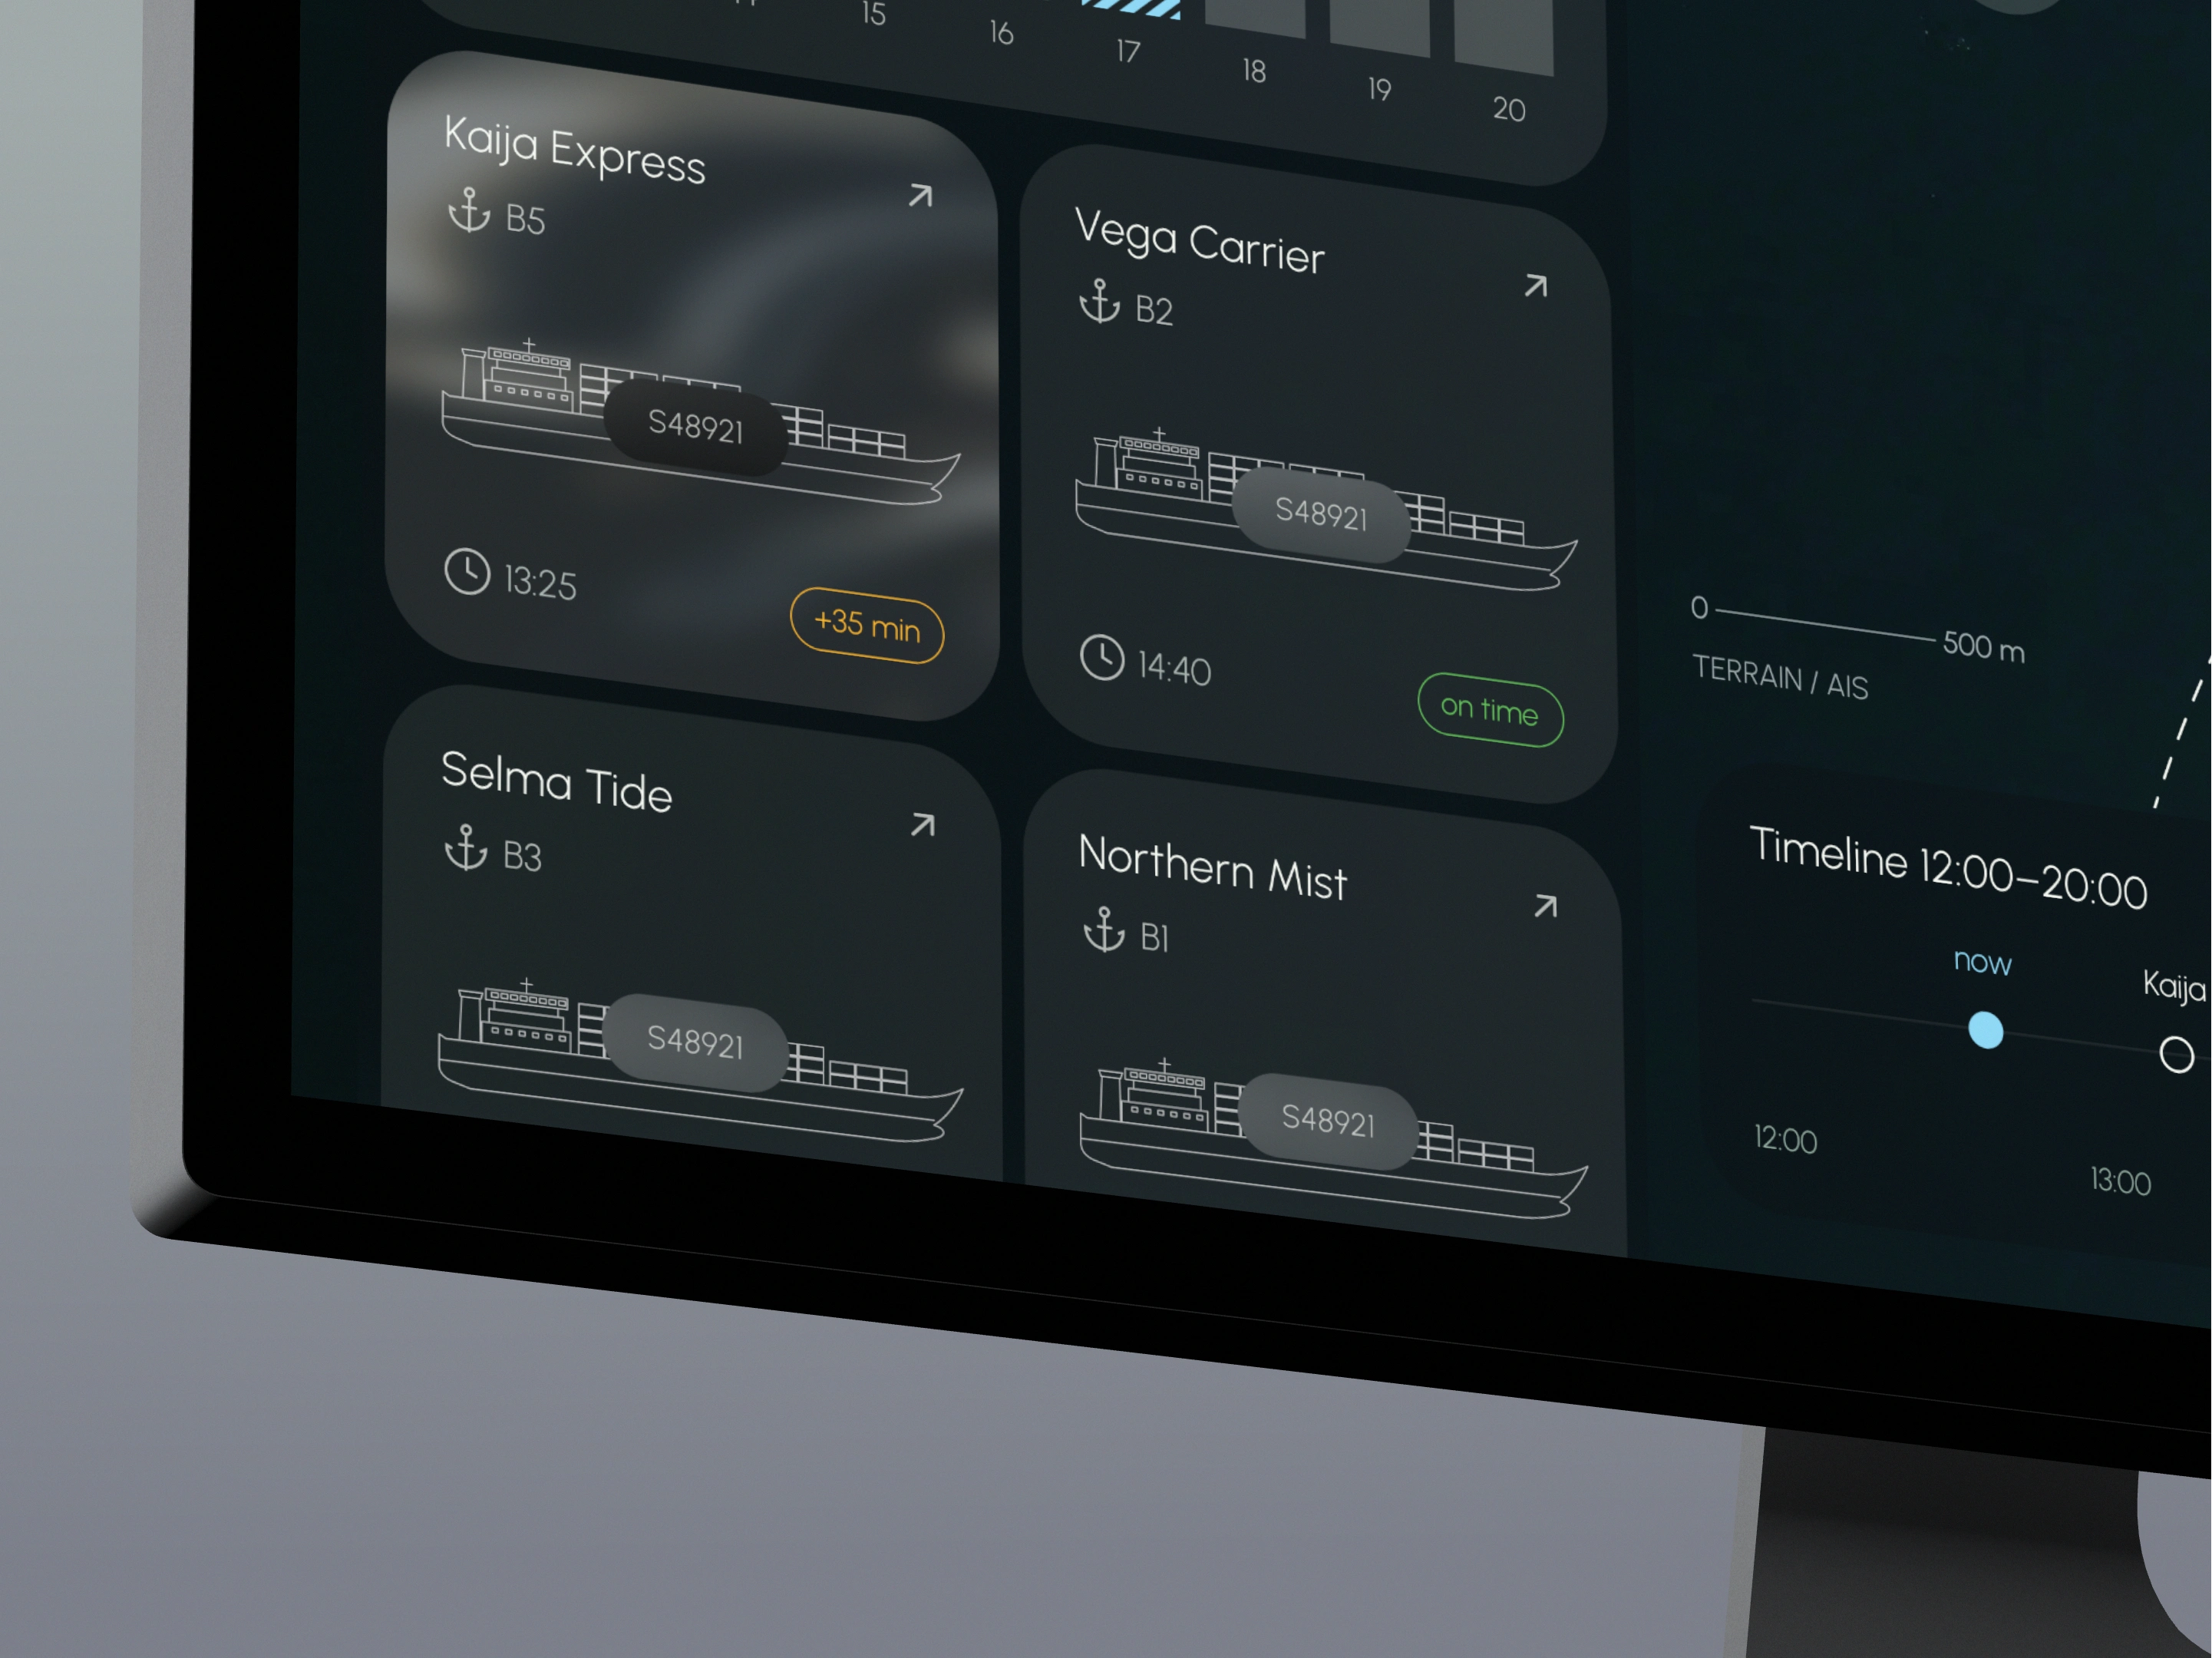
We started by mapping a full operator shift and every data source behind it. From there we built the information architecture, the alert logic and the map-based UX flows. Most of the effort went into combining data that updates at very different rates, from live AIS positions to hourly forecasts, into one timeline that stays readable. The visual system came last. It uses dark green mist, frosted glass cards, thin dotted connections and striped bars, with a single ice-blue accent reserved for anything that needs action.
Key Decisions
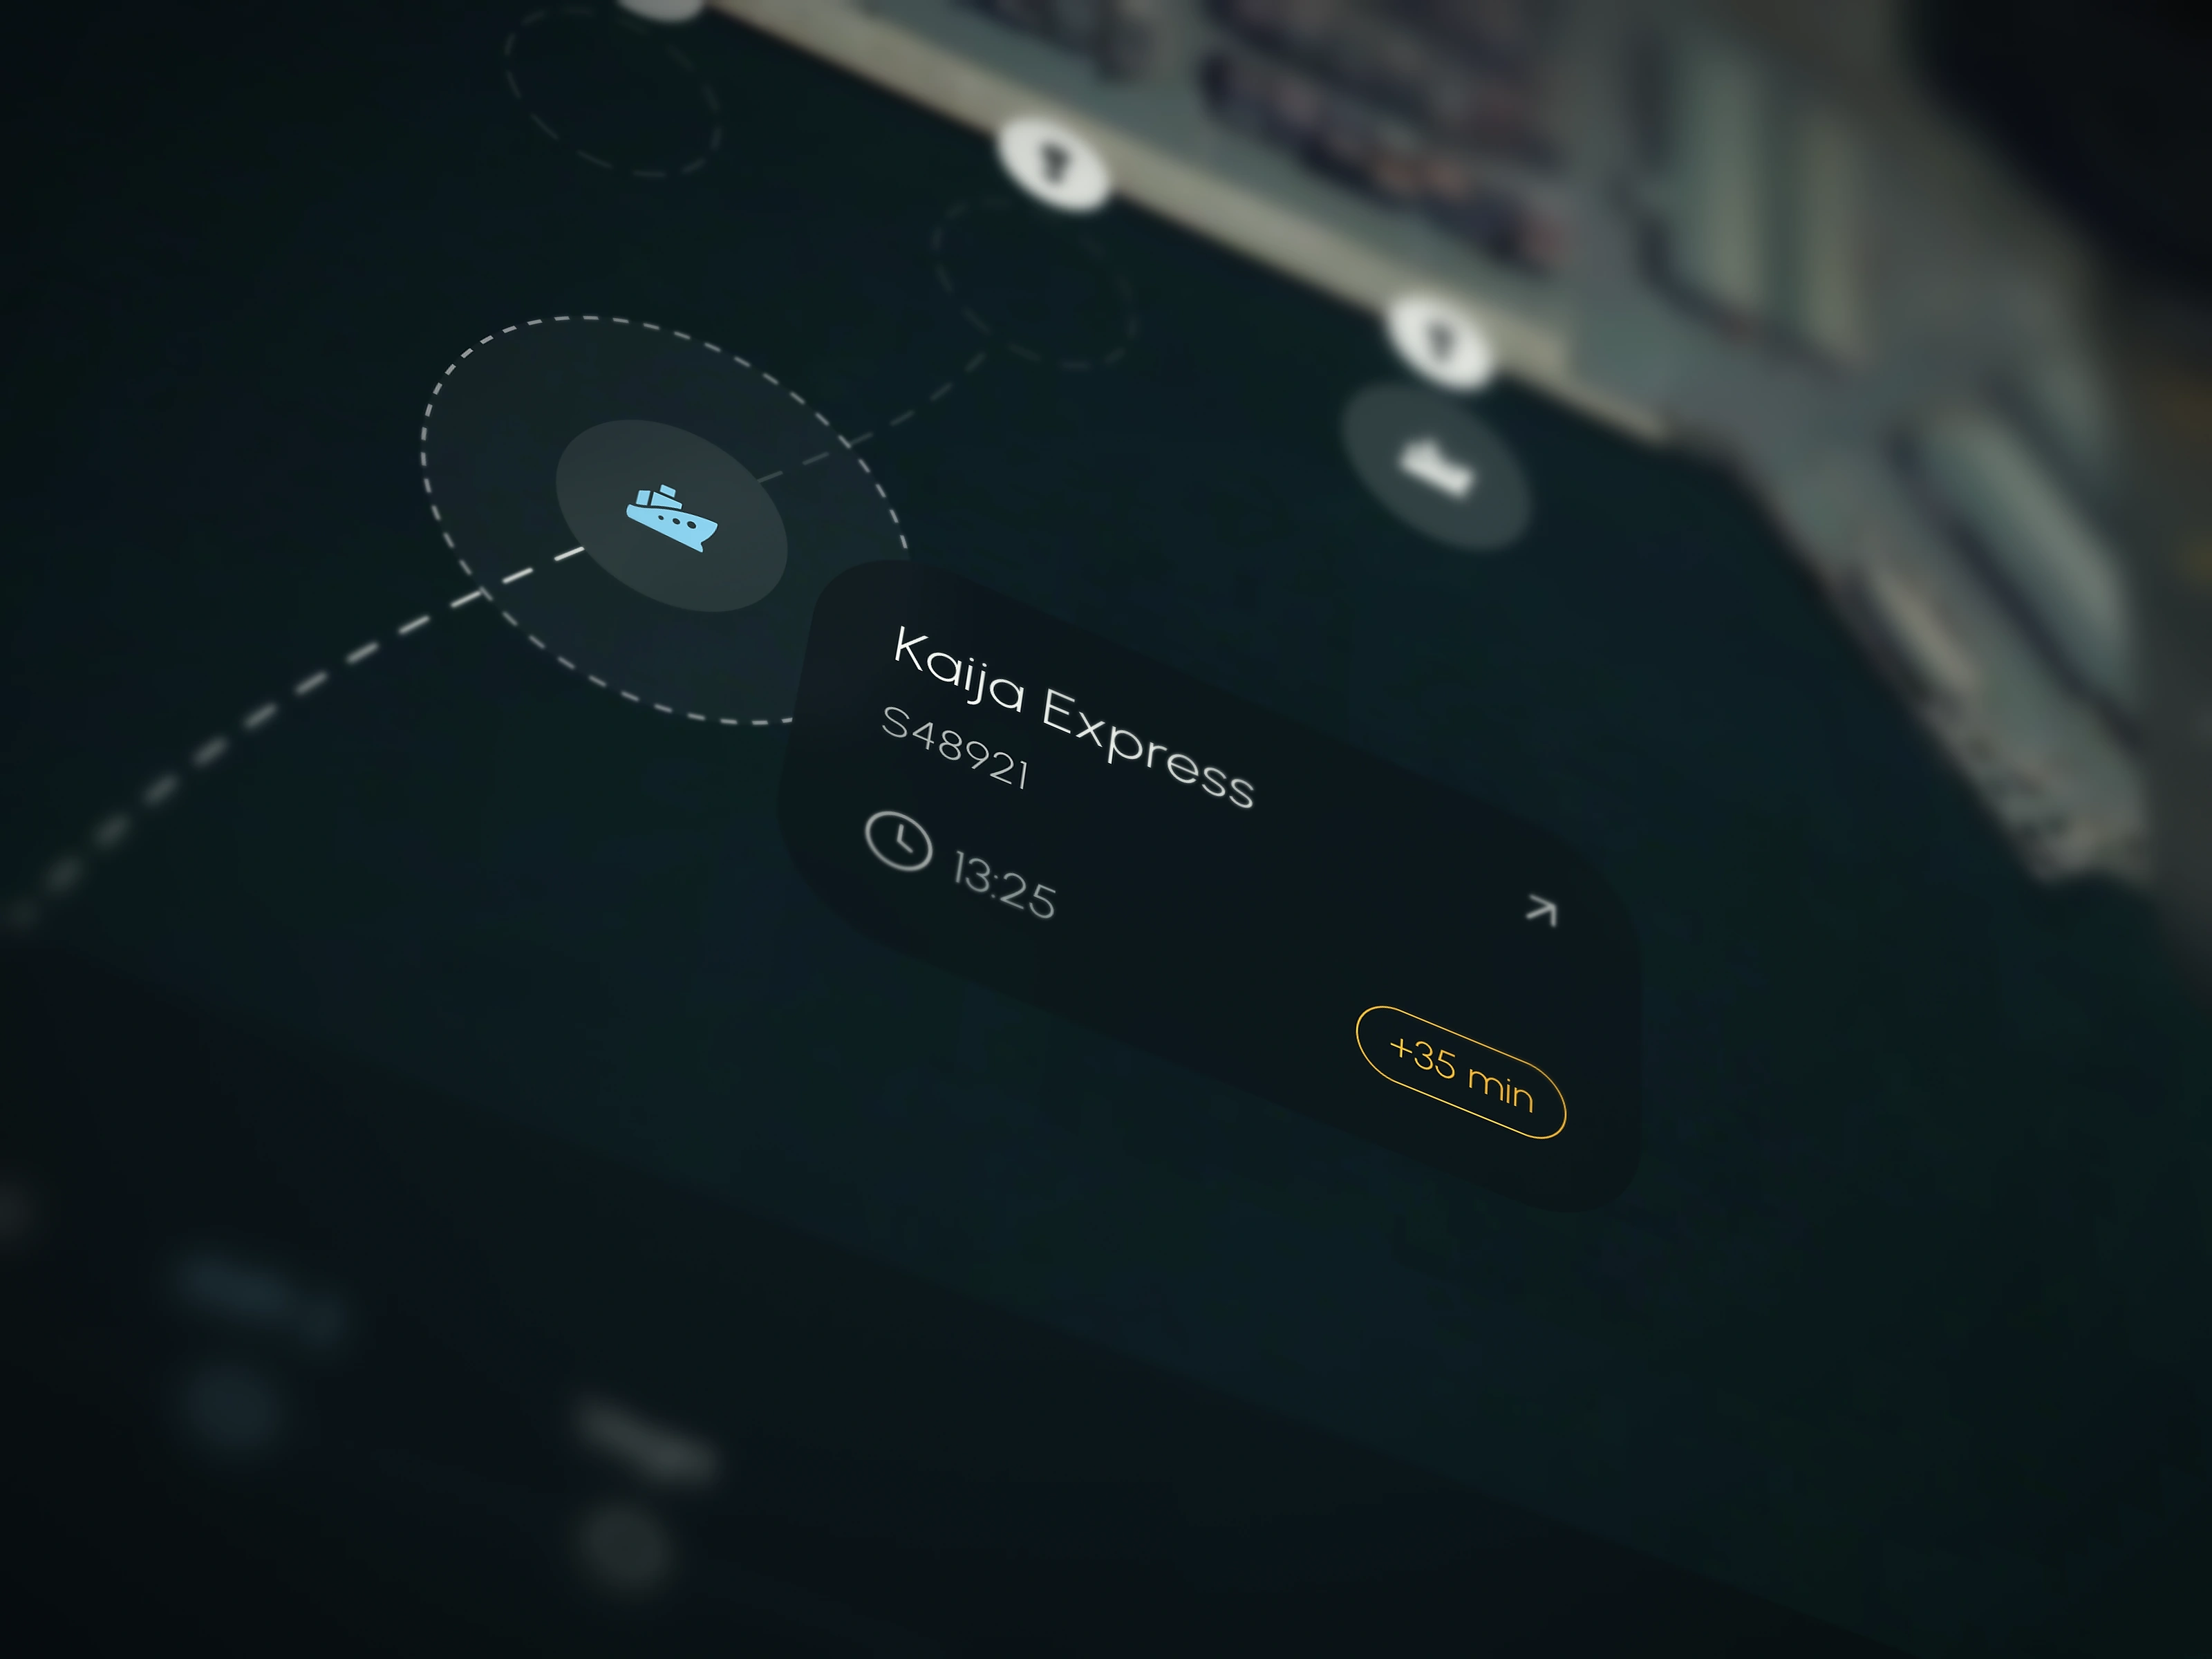
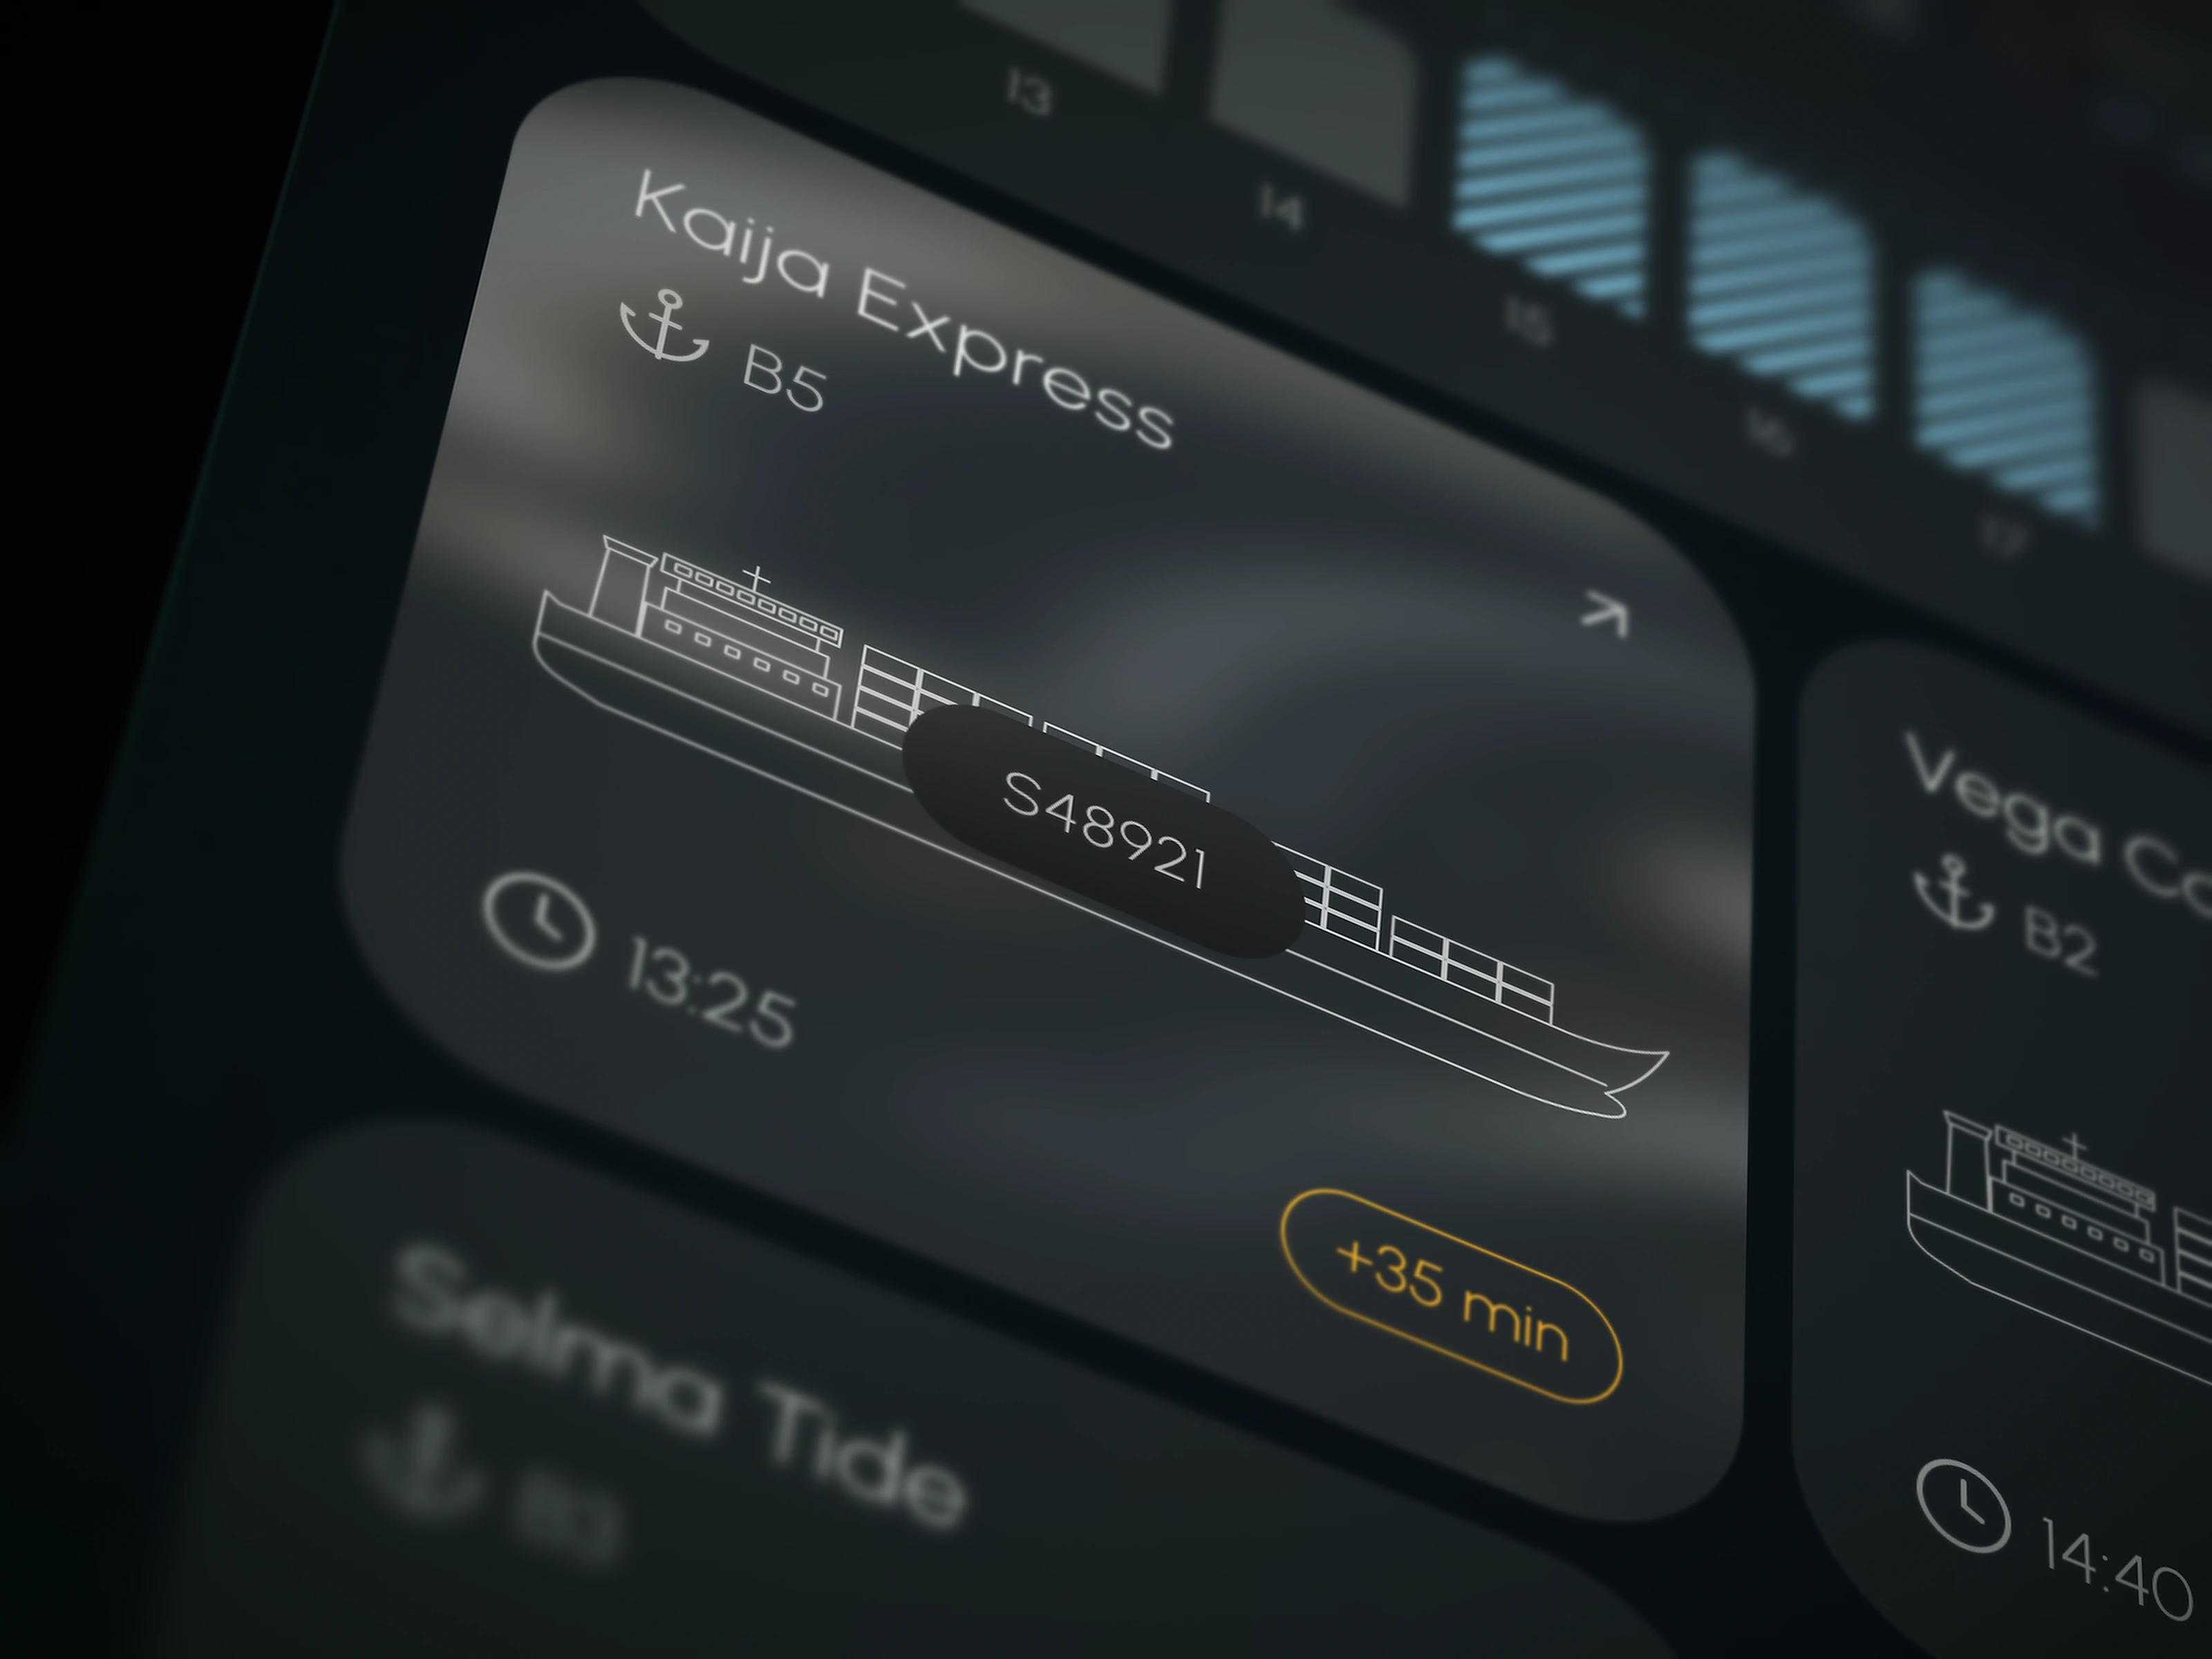
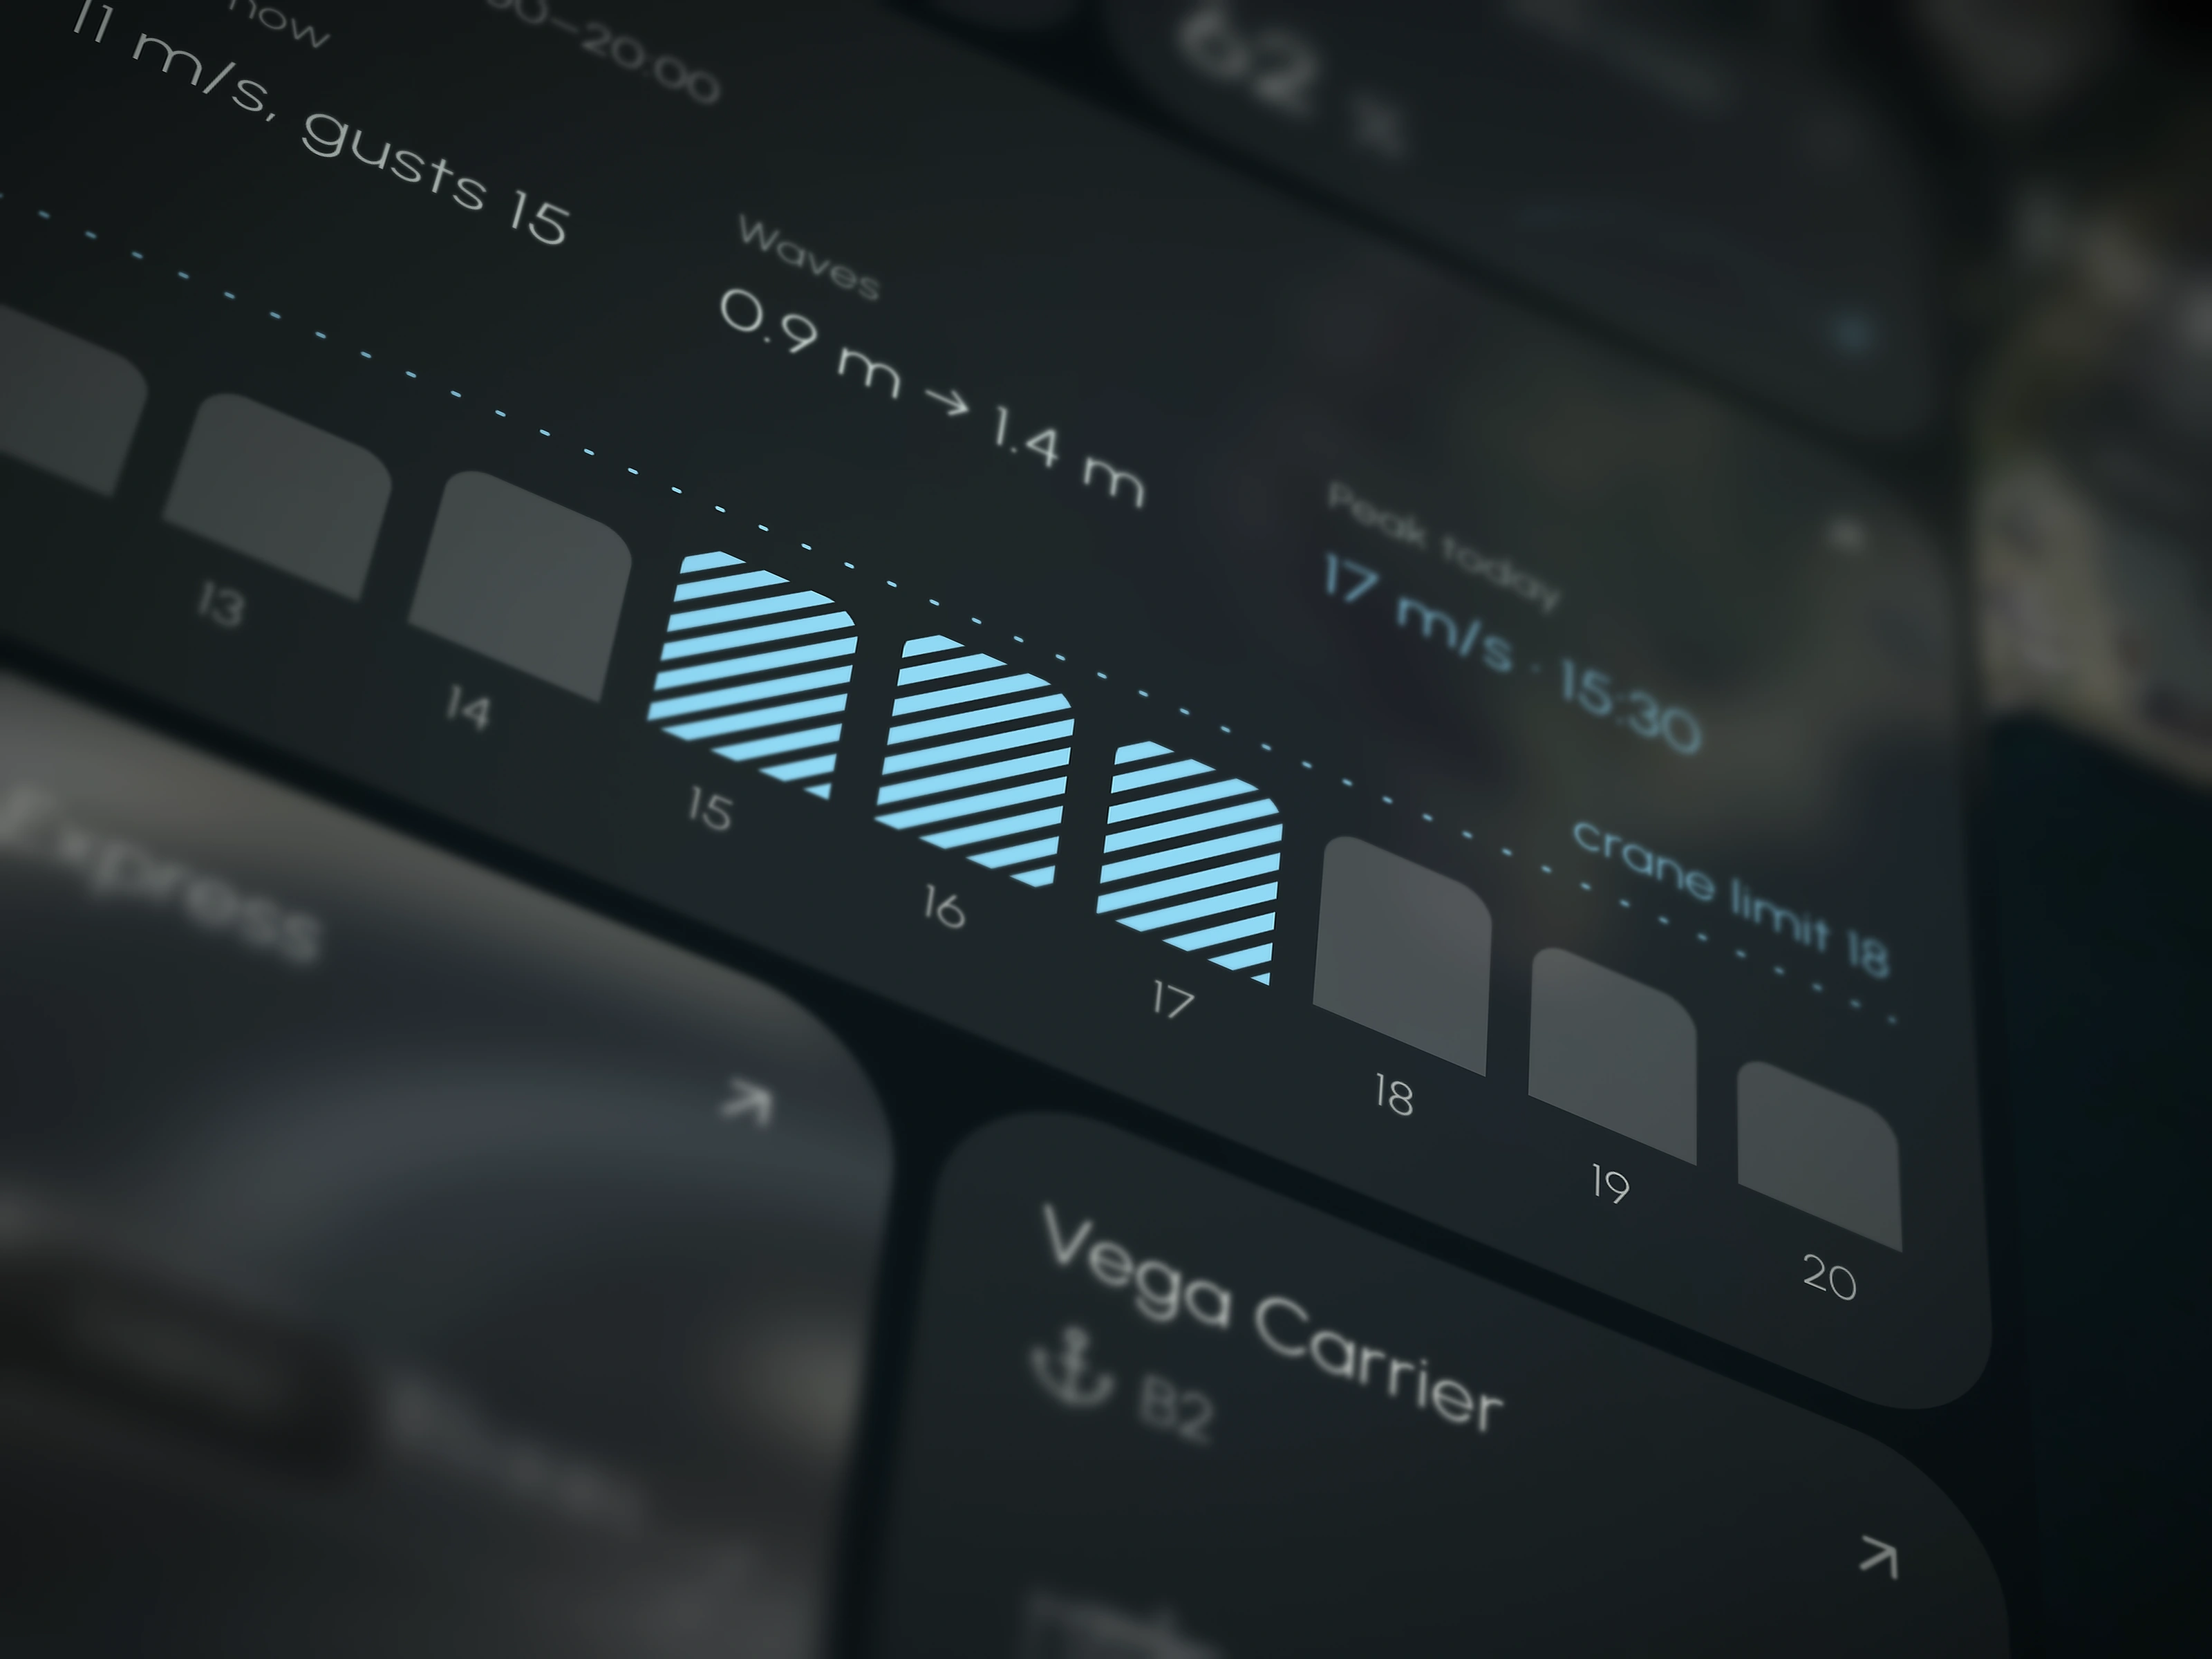
We made the map the main screen, because operators think in quays and berths, not in tables. Each object carries its own status: vessels show ETA and delay, every crane has a load indicator, and berths have occupancy bars. Weather sits right next to operations, with wind and wave forecasts placed against crane limits on the same hourly scale. Alerts are collected into one "before shift" list, so idle cranes, late arrivals and risky wind windows are known before work begins. A shift timeline lets operators scroll ahead and see how the next hours will play out.
Business Growth Effect
With one view of the port, delays and idle time come up before a shift starts instead of after it ends. Operators plan from a shared picture, and foremen on the quay see the same data on their phones. Because it relies only on existing data, the system can grow with new berths and sources without new hardware.
Like this project
Posted Oct 6, 2026
Developed a desktop app for port operators to unify berth plans, crane activity, and weather forecasts.