Healthcare Dashboard

Abdullah Al Noman


A user convenient dashboard to display and track test stats.
We created a dashboard using trackers, line charts, pie charts, and bar charts to manifest and sort test counts. We assigned different colors and icons for each type of test to quickly track and find out about a certain test count.
We used different colors for the charts to visualize and distinguish each test. The user could easily gaze at the chart and comprehend the frequency of a certain test. For cumulative tests, we used bar charts to quickly estimate the total test count
Like this project
Posted Dec 16, 2023
Designing a dashboard that can keep track of the performed tests.
Likes
0
Views
1
Clients
The American Institute of Balance


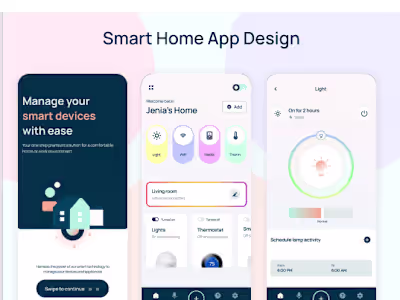
Smart Home App Design

Ecommerce
Management App