Cloud Storage for Battery Energy Storage Systems (BESS)
Christopher Wilhite
Developed the dashboard page for the Tennessee Tech Center for Energy Research BESS project. This utilized a combination of Python, HTML, CSS, and MySQL in order to connect to a database and display interactable graphs to help monitor battery data.
Login and Registration Pages:
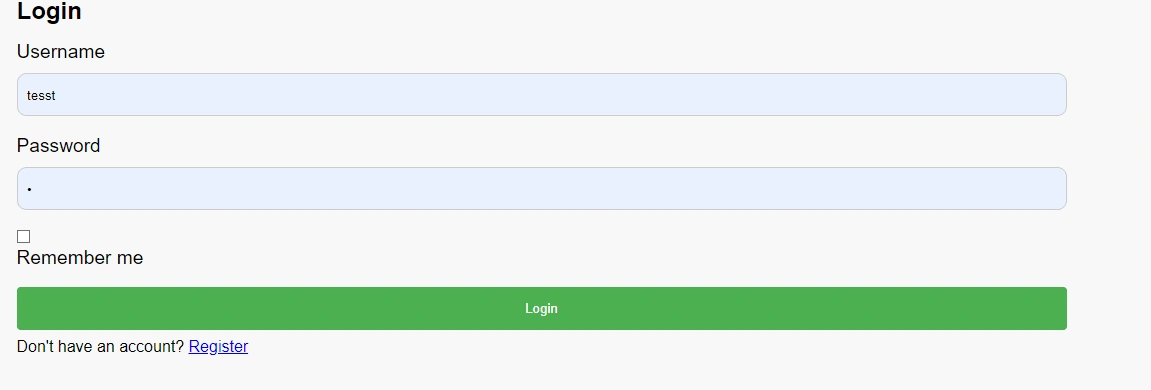
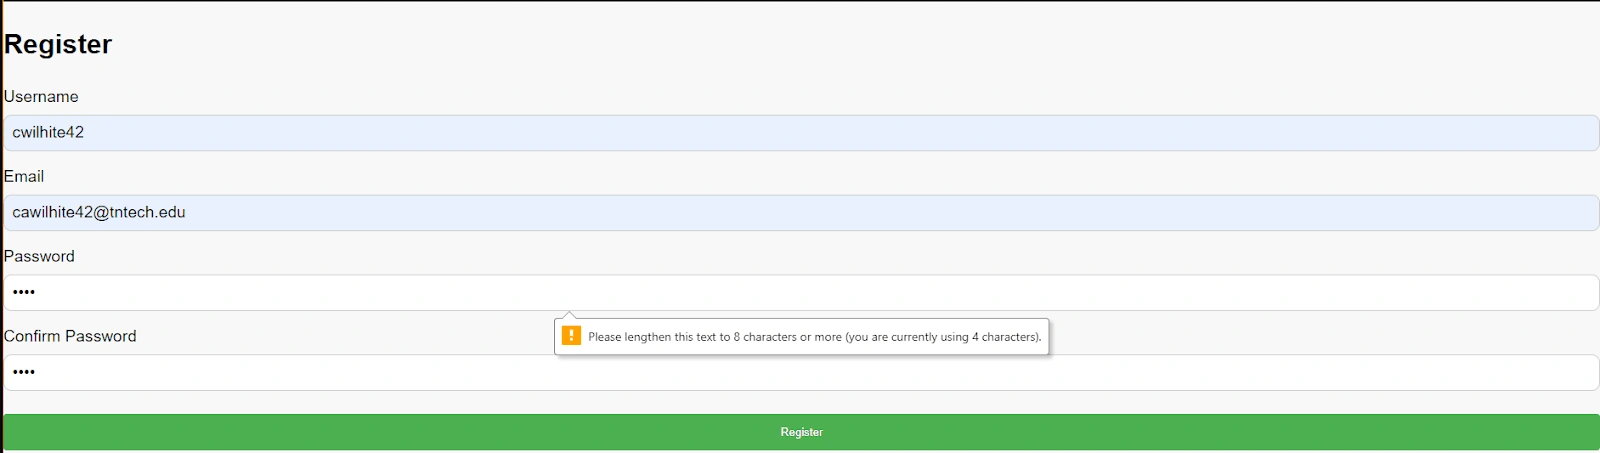
Users are able to create their own personalized logins, which the administrator is able to set specific guidelines for password strength. Wrote the entirety of the web page currently available, storing users to a database and allowing for future logins.
Dashboard
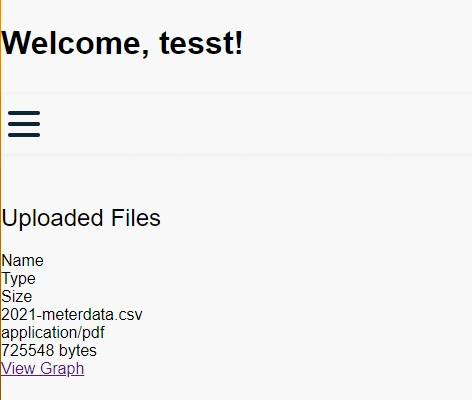
Users are greeted with a welcome message upon login, and data is displayed for the user that is found in the database. The view graph button will then redirect users to a new page with the graph display.
Graph Display
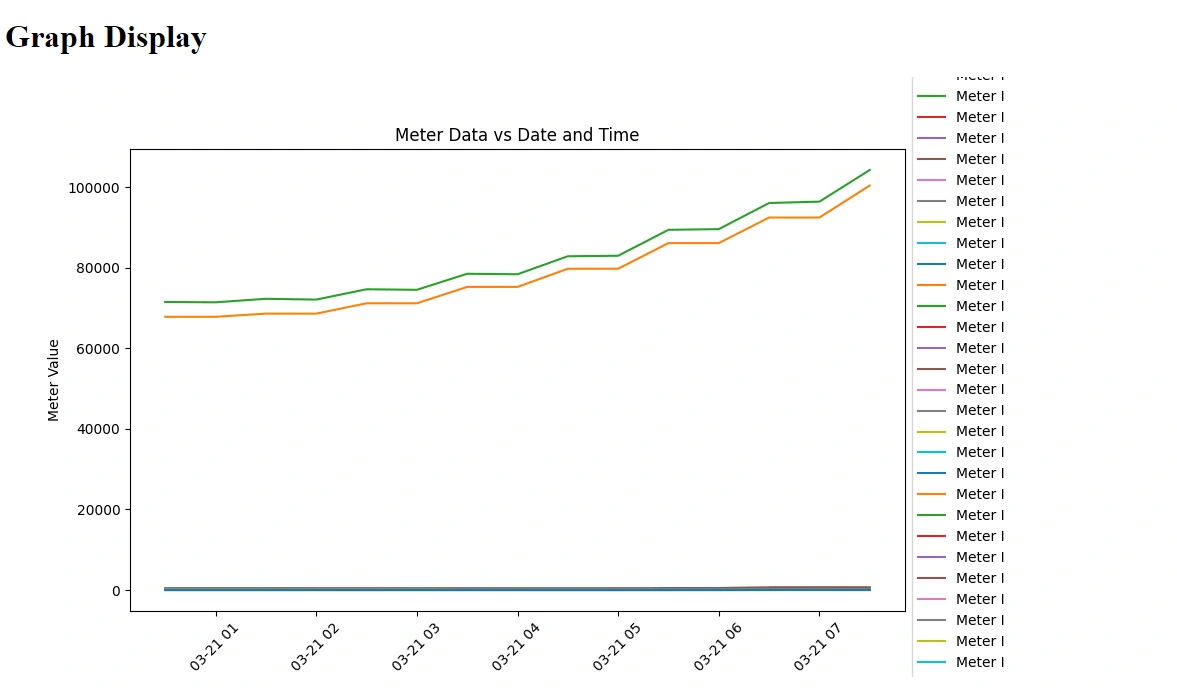
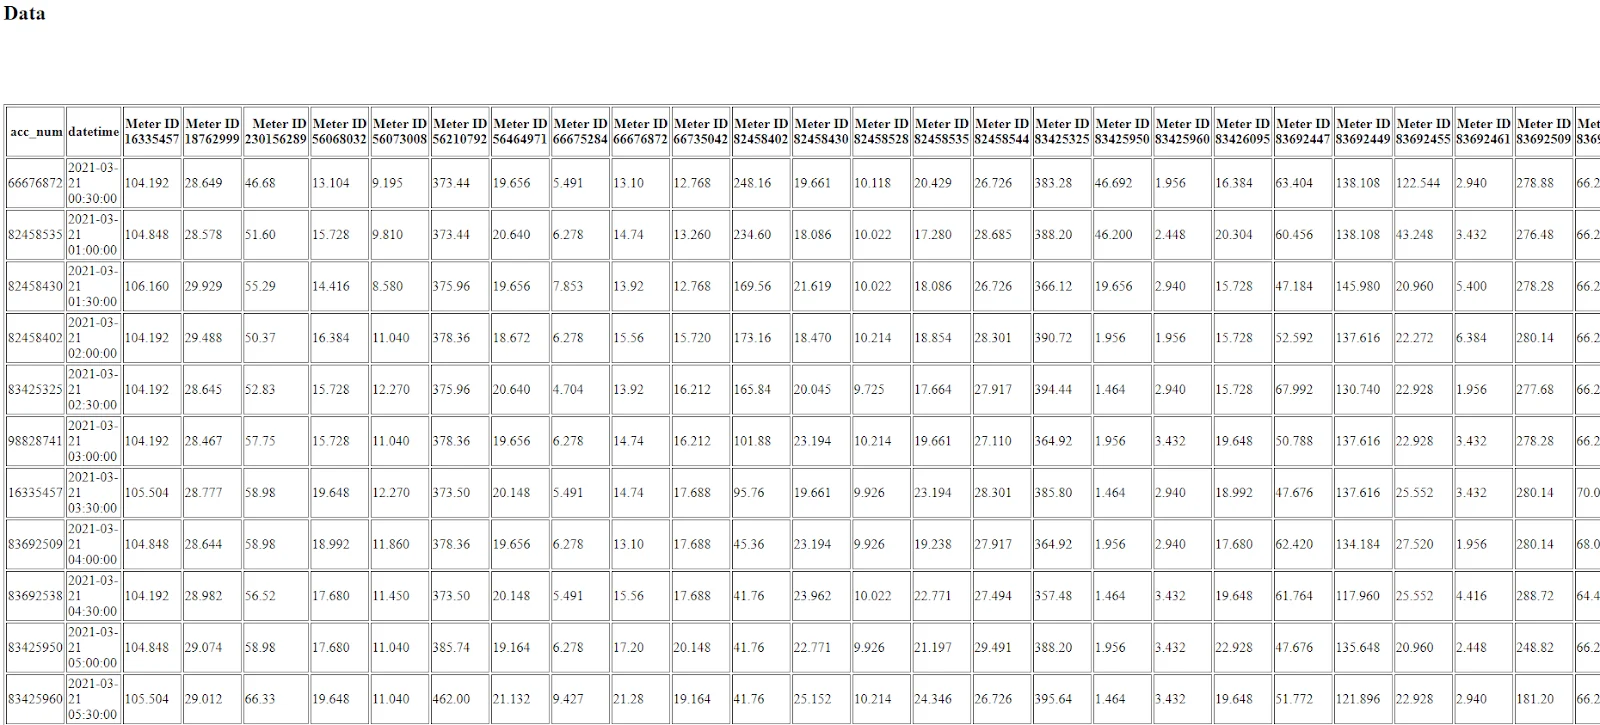
The code will accurately classify the data by datetime within the numpy array and is able to be used when graphing.
Project Notes
This project is still in active development so more updates will be posted upon completion. The client has requested a very simplistic approach and the design reflects accordingly.
Like this project
Posted Dec 20, 2023
Developed the dashboard for the BESS project.
Likes
0
Views
3