Stock Market Analysis Model
Christopher Wilhite
In this project, we perform Stock Market Analysis, leveraging machine learning algorithms, specifically Long-Short Term Memory (LSTM) and Support Vector Regression (SVR), to predict the behavior of different stock categories, including Blue Chip and Penny Stocks. We delve into the challenge of adapting these algorithms to the unique characteristics of each stock type, while also comparing their performance in predicting volatile versus non-volatile stocks. Real-time data from Yahoo! Finance ensures the timeliness of our analysis, and our choice of LSTM and SVR is rooted in their ability to handle time-series data effectively. Ultimately, our project aims to empower investors with insights to navigate the dynamic landscape of the stock market.
Introduction to the data
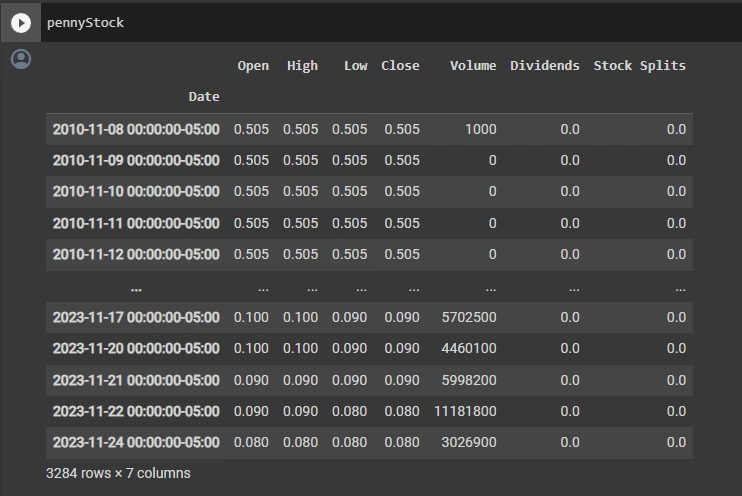
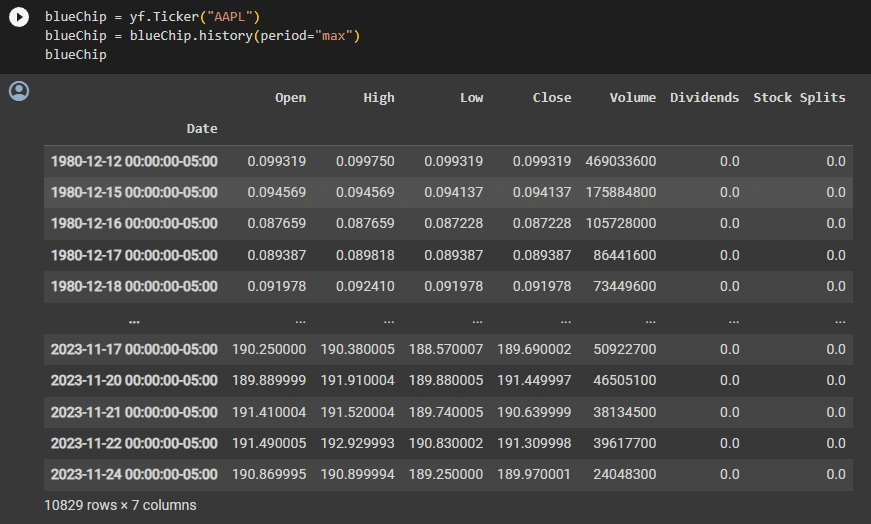
This dataframe represents historical stock market data for a specific stock or security. It contains information for various columns, each representing different aspects of the stock's performance on specific dates.
The columns in this dataframe include:
Open: The opening price of the stock on a particular date.
High: The highest price the stock reached during the trading session on that date.
Low: The lowest price the stock reached during the trading session on that date.
Close: The closing price of the stock on that date.
Volume: The trading volume, i.e., the total number of shares traded on that date.
Machine Learning Algorithms Used
Long-Short Term Memory (LSTM):
Type: LSTM is a type of recurrent neural network (RNN).
Purpose: LSTM is particularly well-suited for handling time-series data, making it a valuable choice for modeling stock market behavior. It can capture patterns and dependencies in sequential data, which is essential in understanding the dynamics of stock prices over time.
Usage: LSTM is suitable to be used for both regression and classification tasks.
Support Vector Regression (SVR):
Type: SVR is a type of supervised machine learning algorithm used for regression tasks.
Purpose: SVR is useful when you want to approximate a function that relates input variables (time series data in the case of our project) to a continuous target variable while minimizing prediction errors. SVR is versatile and can handle non-linear relationships between features and targets.
Usage: SVR is well-suited for regression tasks, where the aim is to predict numerical values related to stock market data, such as stock prices or returns.
SVR Method
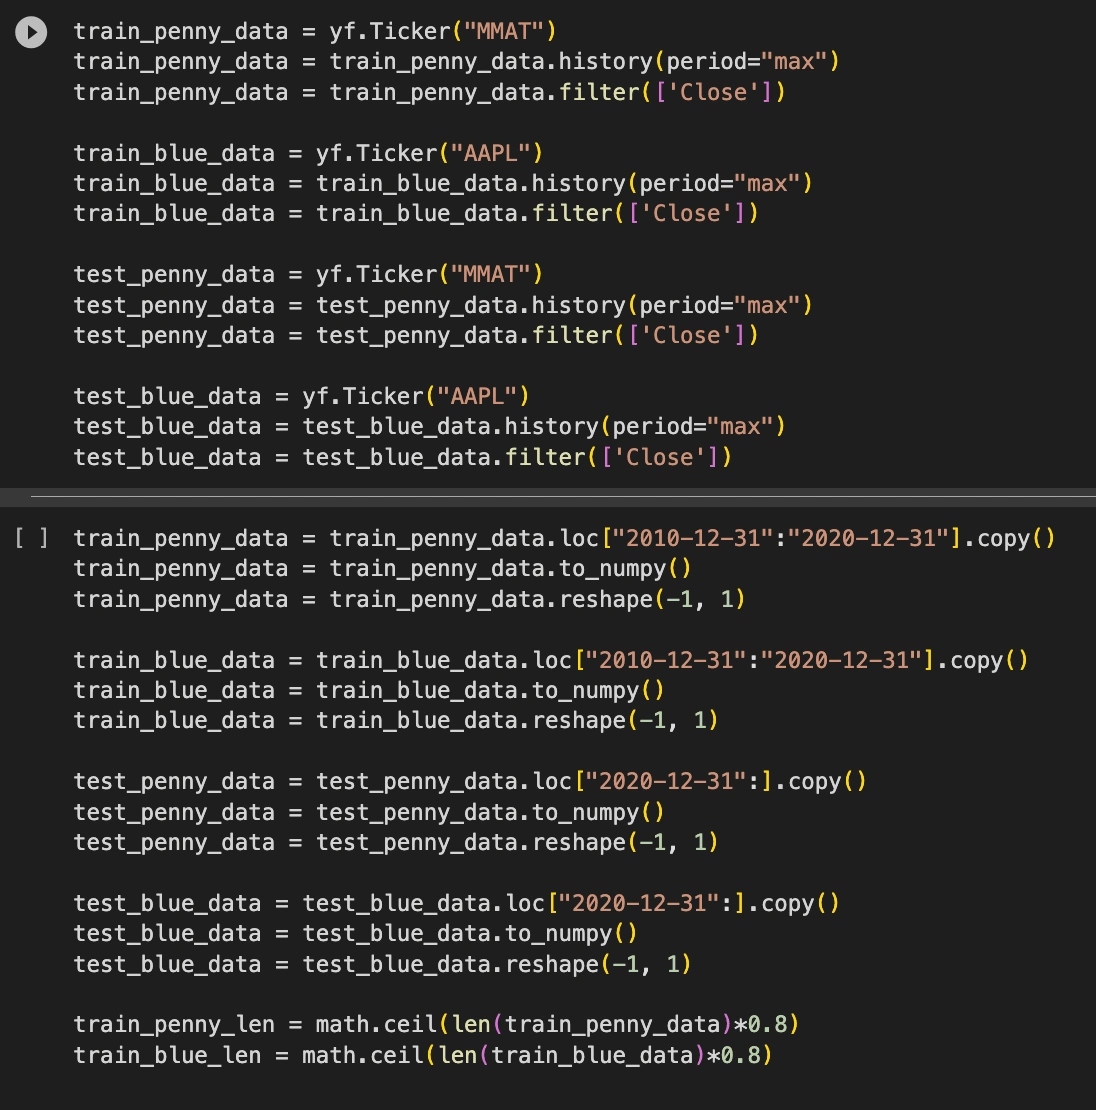
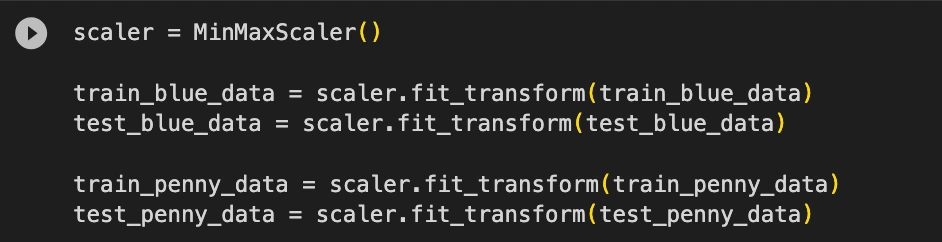
Normalization: Each training data set for the blue chip stock and for the penny stock were condensed down to 10 years of the stock’s closing price; in this instance it was trained on data from 2010-12-31 to 2020-12-31. Additionally the stock’s closing price values within those ten years were each scaled to a continuous value within 0 and 1.
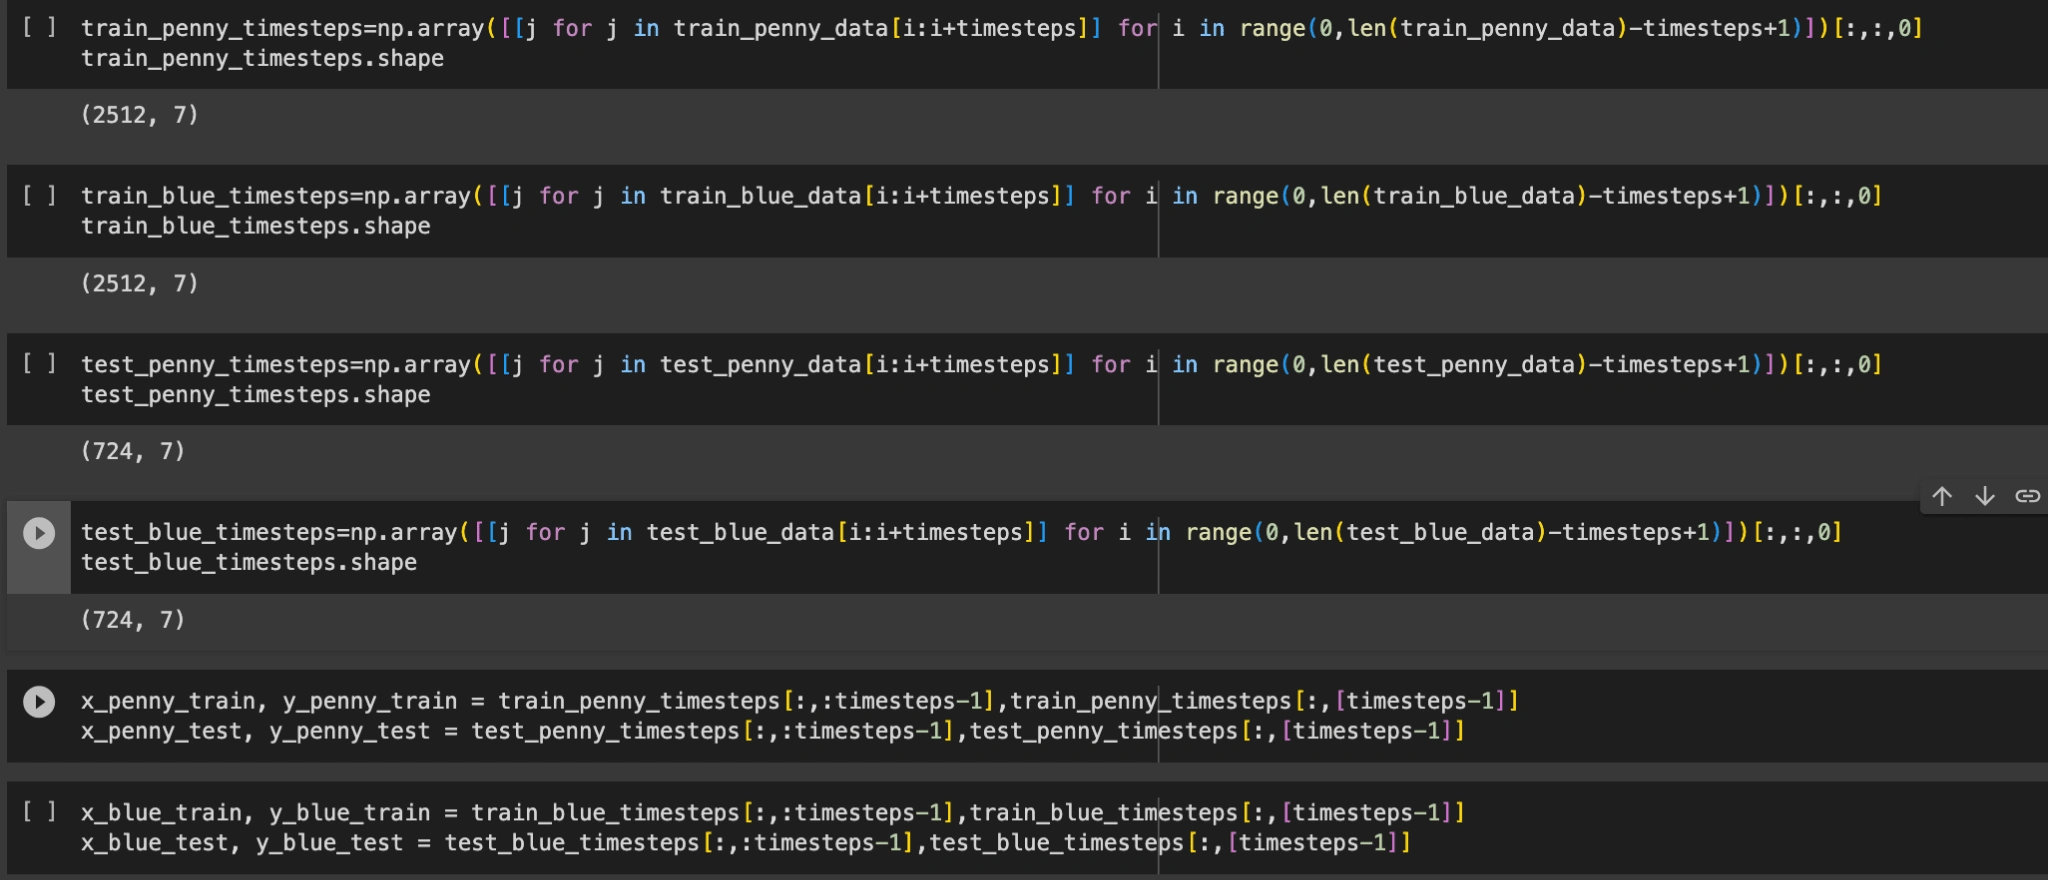
Data Preparation: To prepare the data for the SVR model you must create an additional feature called timestamps. IN essence if the time step is 7 the model will take in the first 6 timesteps as input and the the output will be the 7th timestep. Once the timestep feature is created you have a 2D array which will be fed to the model
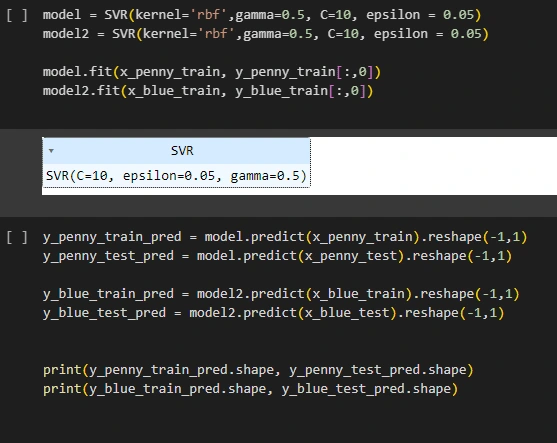
Model Info: Using each stocks training datasets we will now create an SVR model with a Radial Basis Function kernel with randomly selected and tested hyper parameters
(gamma 0.5, C = 10, epsilon = 0.05)
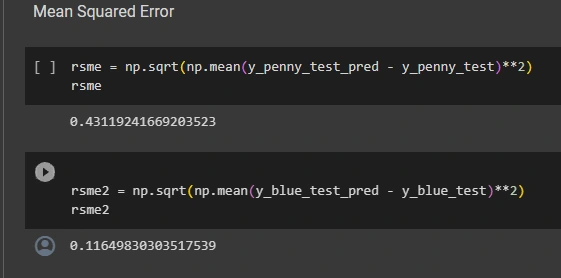
Prediction: Using the trained models we will create a test dataset that is based on the stocks previous 3 years and test the models’ predictions using mean squared error to conduct performance evaluation.
Data Handling
When it comes to handling stock market data the process is actually very straightforward. Since stock market data is very well kept and uniform, there is no missing values in the closing price of each of these stocks.
After creating a training set on ten years of historical data 2010-12-31 to 2020-12-31 we then put all those closing price values into a continuous range from 0 to 1
The test dataset was structured identically, however it only took the stock’s closing price from the last three years..
In addition to extracting time-specific data on the stock’s closing price we also have to create timesteps as an additional feature of our training and test data in order to successfully fit an SVR model to run predictions.
SVR Results and Comparison
Once we have created a proper training data set and test data set we can start to fit an SVR model for each stock.
After testing, we found that SVR the SVR model we used always overfit the data. Regardless of different instances of the training and test data.
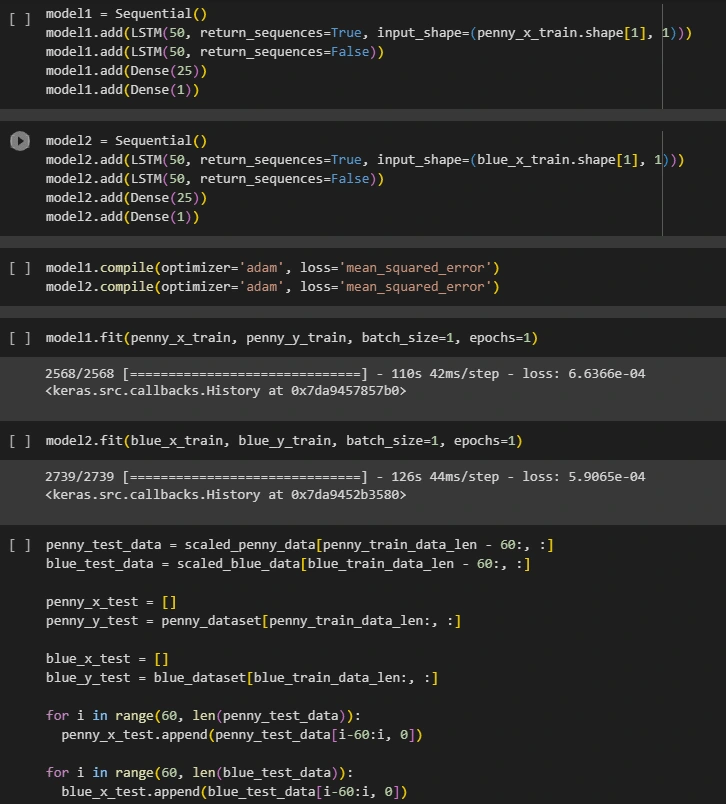
LSTM Neural Network
Normalization: The initial step in our workflow involved normalizing each of the training datasets to a continuous range between 0 and 1. This critical preprocessing step ensures uniformity and consistency in the data, making it suitable for training machine learning models. To achieve this, we employed the MinMaxScaler function from the scikit-learn (SKlearn) library, a widely recognized industry-standard practice.
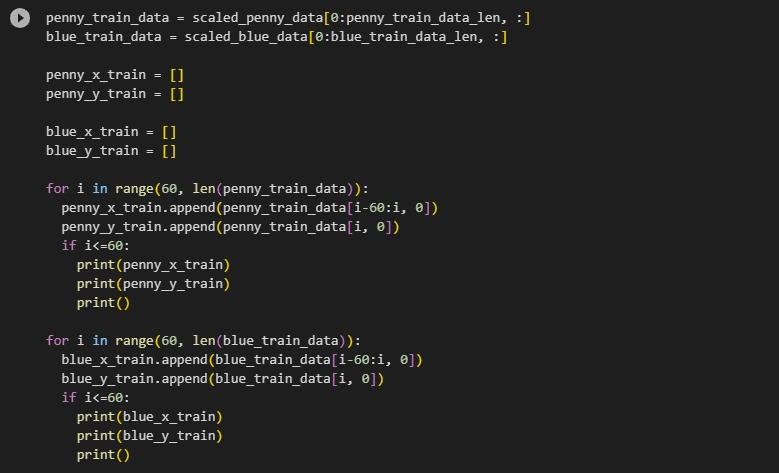
Data Preparation: In the data preparation phase, we meticulously organized the raw training data for both the Penny and Blue stocks. This meticulous process involved the careful division of each dataset into two distinct sets: the input features (X) and the corresponding target values (Y). The resulting datasets were thoughtfully transformed into efficient NumPy arrays, optimizing computational efficiency and data integrity.
Model Development: Leveraging the organized X and Y training datasets, we proceeded to construct two distinct machine learning models tailored to the unique characteristics of the respective datasets. In our model development, we, employed the adam optimizer and the mean squared error loss function. These choices were made for the reliability of the models’ ability to perform subsequent predictive tasks.
Prediction and Evaluation: Following the meticulous model training, we began the to run test and compare each models performance. The trained models were tested on a subset of the data that they had not been exposed to during the training process. The aim here was to assess the model's predictive power and generalization capabilities. Subsequently, we subjected the model predictions to a comprehensive comparative analysis against the ground truth data, yielding insights into the model's effectiveness and reliability.
Data Handling
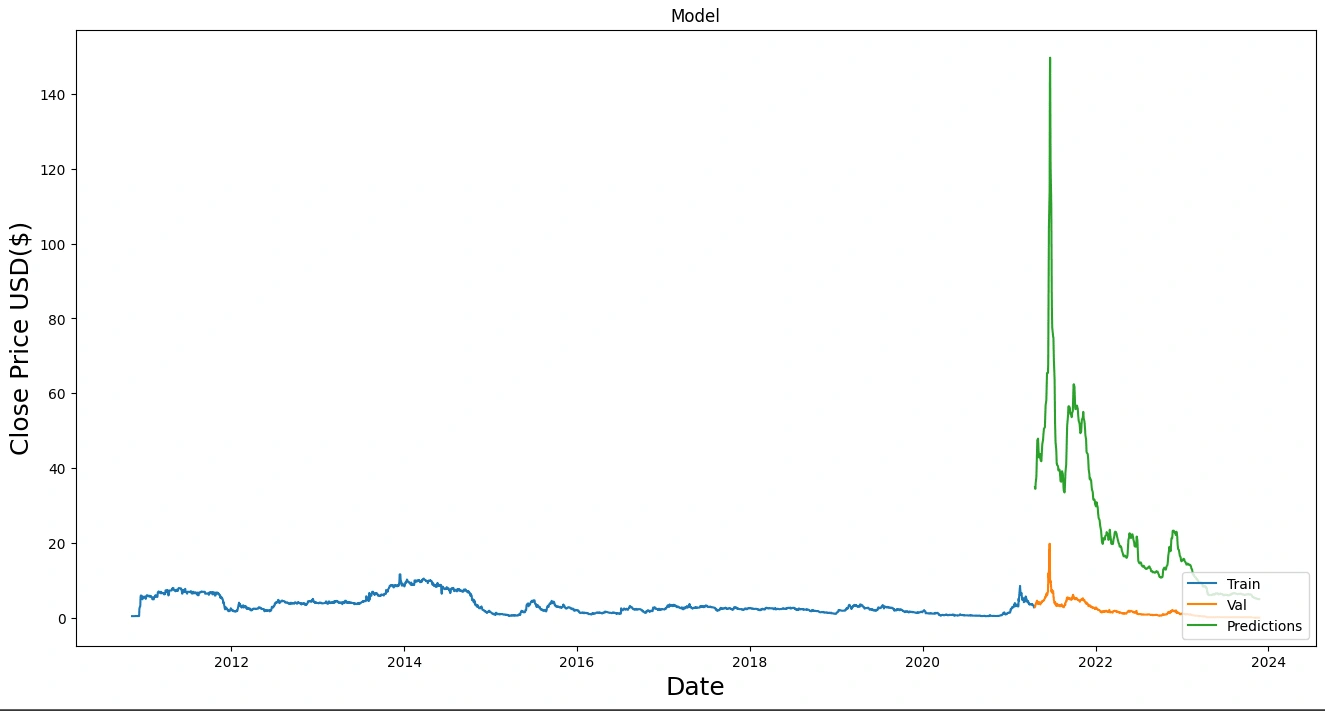
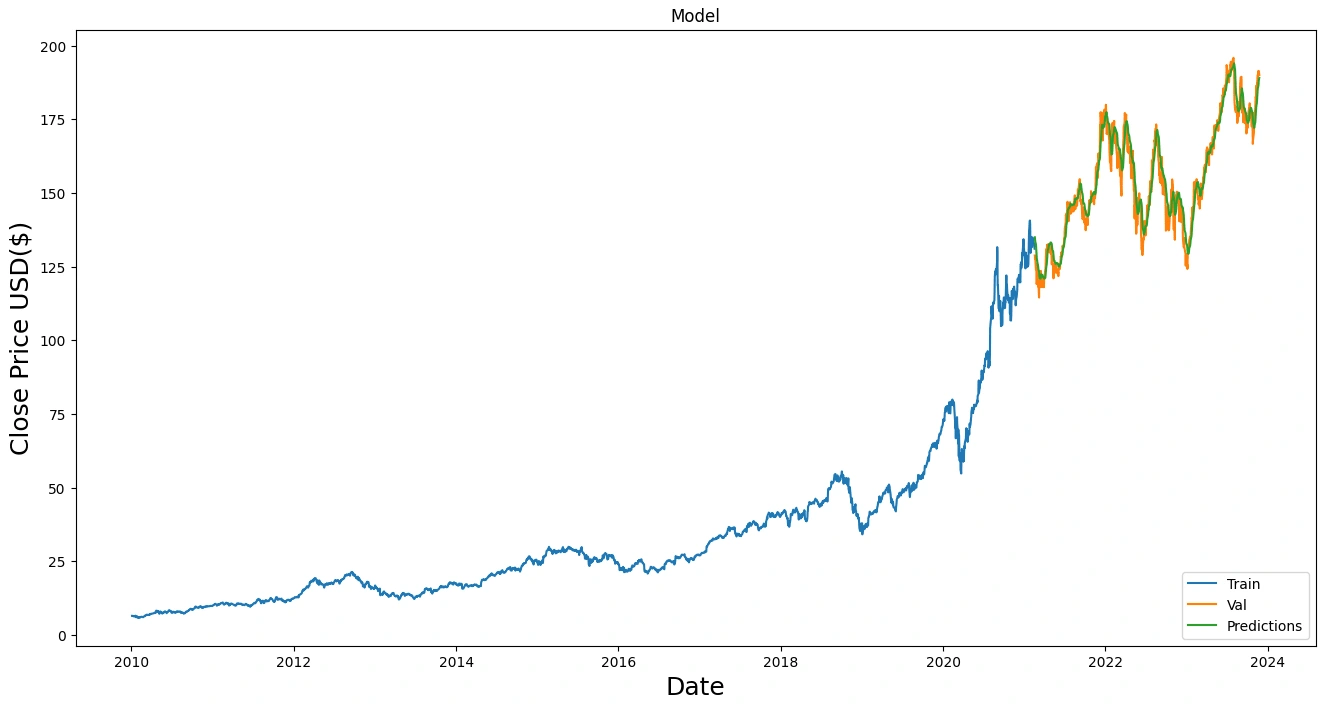
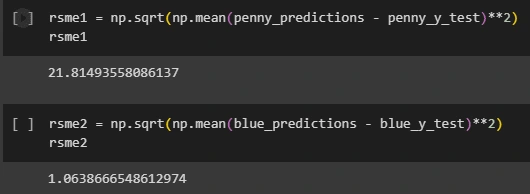
LSTM Results and Comparison
Like this project
Posted Dec 20, 2023
We analyze stock markets with LSTM and SVR to predict Blue Chip and Penny Stocks, comparing volatile vs. non-volatile stocks for investor insights.
Likes
0
Views
7