New York City Airbnb Listings
Shana Nasrin
I dive into an analysis of New York City’s Airbnb listings to uncover meaningful insights for hosts and travelers. I start by introducing the dataset, which contains over 48,000 listings from Kaggle, and share the steps I took to clean and transform the data. Using SQL, I explore host distribution, room types, and the activity levels of hosts across the city. I discovered that most listings are entire homes or apartments, with Manhattan leading in terms of volume. Interestingly, a small percentage of hosts manage multiple listings, suggesting the presence of professional operators in the market.
I used Power BI to create dynamic visualizations that illustrate key trends, such as price differences across neighborhoods. Manhattan and Brooklyn emerged as the most expensive areas, while some neighborhoods offered budget-friendly options. I also examined booking patterns and found that high-demand neighborhoods are often close to tourist attractions. In the article, I provide actionable recommendations for new hosts, such as choosing the right property type and focusing on location to maximize occupancy rates. This project allowed me to combine SQL and Power BI to generate insights that can help both hosts and guests make informed decisions.
Here is the complete tutorial of this project: Airbnb Listings
Dashboard
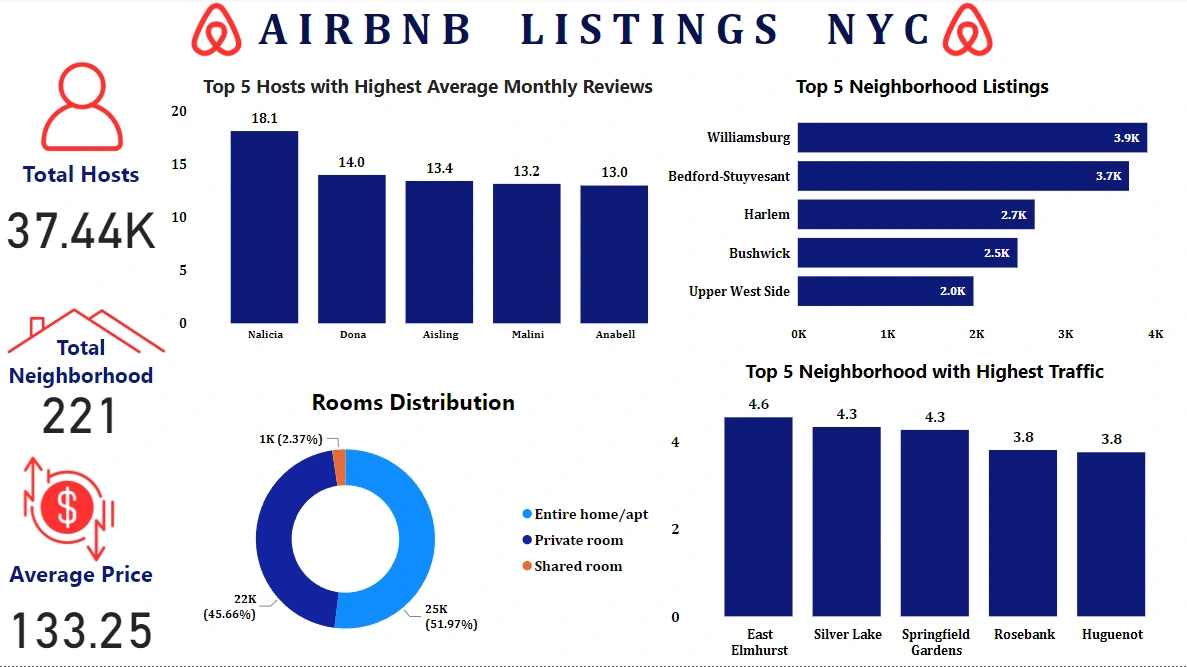
Airbnb Listings Power BI Dashboard
Like this project
Posted Dec 31, 2024
Analyzed NYC Airbnb data using SQL & Power BI, uncovering trends in host activity, room types, pricing, and demand to provide insights for hosts and travelers.
Likes
1
Views
14