Sales Analytics Dashboard & Forecast Tool
Isaac Somuah
Excel Sales Dashboard Project
Overview
I developed a comprehensive Excel dashboard to visualize and manage sales data, providing key insights and predictions to support business decision-making as a medical representative. This tool is being used by all medical representatives.
Project Features
1. Sales Dashboard:
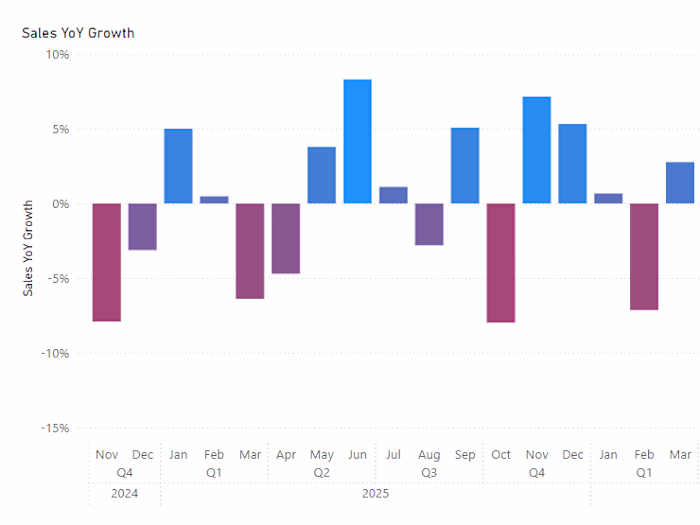
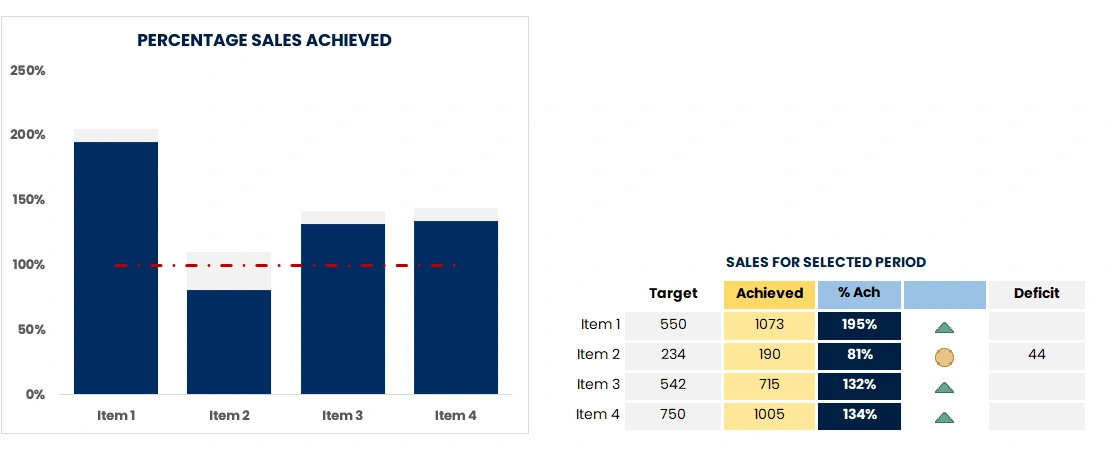
Displays sales data over different time periods, including year-to-date (YTD) and growth over the previous year.
Users can interact with charts to see detailed sales trends and comparisons.
2. Orders Page:
Simplifies the entry of sales data, ensuring accurate and up-to-date information.
3. Customers Page:
Maintains detailed records of customer information for better relationship management.
4. Products Page:
Product Details: Keeps track of product information, enabling efficient inventory management.
5. Predicted Stockouts Page:
Tracks and predicts when a customer is likely to buy next and their current predicted stock quantity, helping prevent stockouts.
Technical Details
Data Modelling: Utilized Excel's Data Model to organize and relate different data tables, ensuring efficient data management and retrieval.
Data Preparation: Leveraged Excel Power Query with M-language for data cleaning and transformation, preparing the data for analysis and visualization.
Custom Calendar Table: Built a separate calendar table to align with the office's unique calendar system, ensuring accurate time-based analysis and reporting.
Skills Demonstrated
Data Analysis and Visualization
Excel Power Query and M-language
Data Modelling
Inventory and Sales Management
Predictive Analytics
Like this project
Posted Sep 9, 2024
Developed a comprehensive Excel dashboard to visualize and manage sales data, providing key insights and predictions to support business decision-making