Sales Dashboard – Category Trends, Orders & Revenue Insights
Ranjit Karambalkar
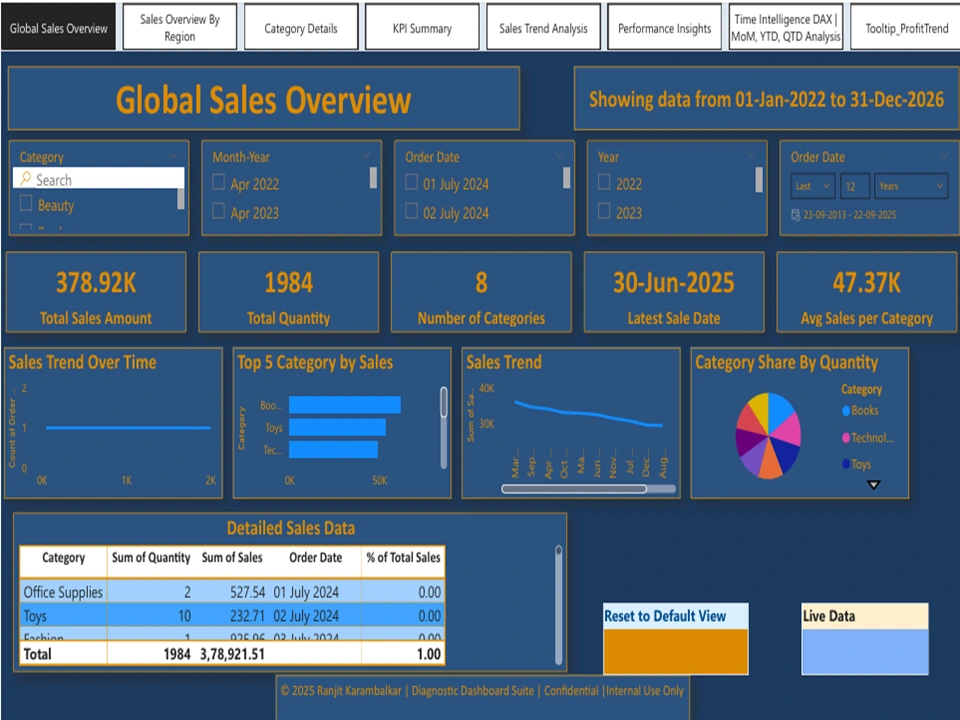
Sales Dashboard – Category Trends, Orders & Revenue Insights
Like this project
Posted Sep 23, 2025
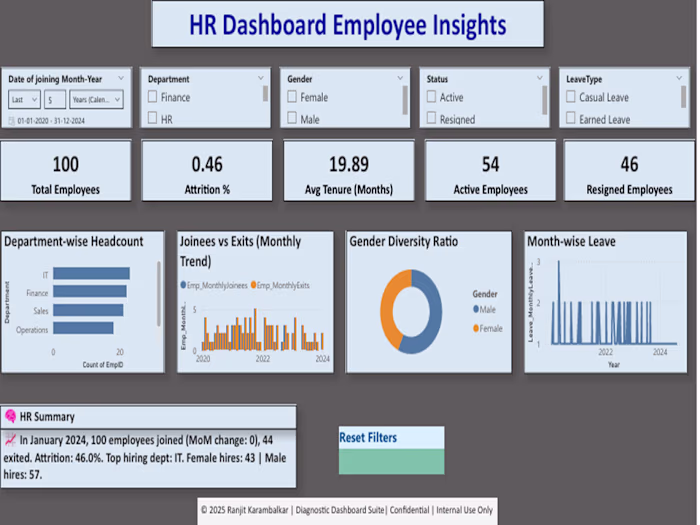
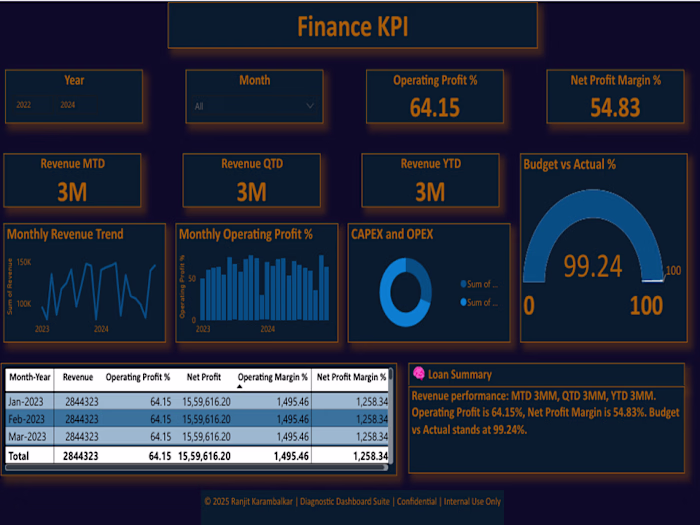
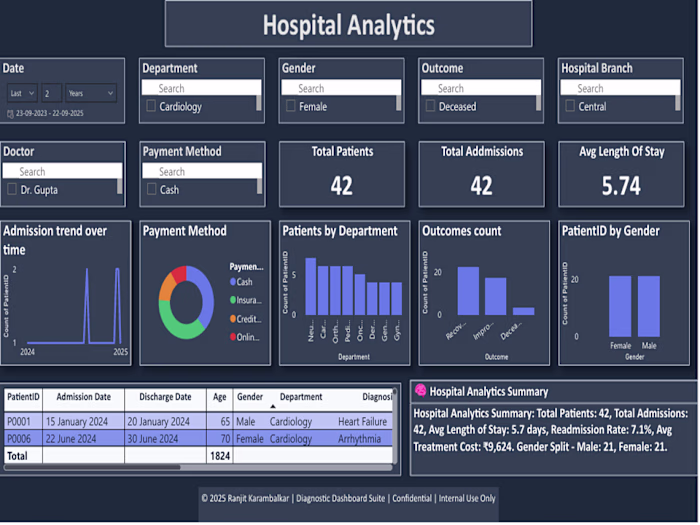
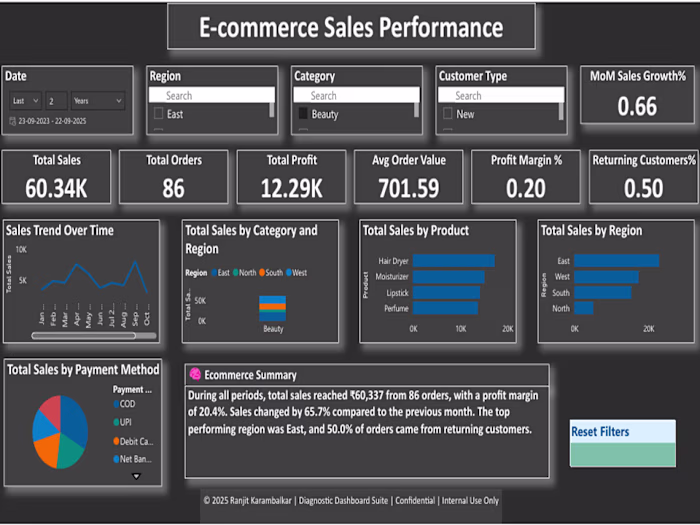
Built a Sales Dashboard in Power BI to visualize category-wise revenue, order volume, sales trends, and performance insights across years.