Next Rain: Mapping Barcelona's October Flood in 24 Hours

Andrés Sepulveda Morales


Next Rain: Mapping Barcelona's October Flood in 24 Hours
What shipped
A working phone app, live at next-rain-barcelona.netlify.app. It runs a physics simulation of how water moved through 2,224 street segments in the centre of Barcelona, and shows reviewed press and city reports of where the city actually flooded. A what-if planner tests rain against drain capacity, and a resident view answers "is my street at risk?" in plain words. Three languages, works offline, built in 24 hours by a team of three at the Barcelona AI Hackathon.
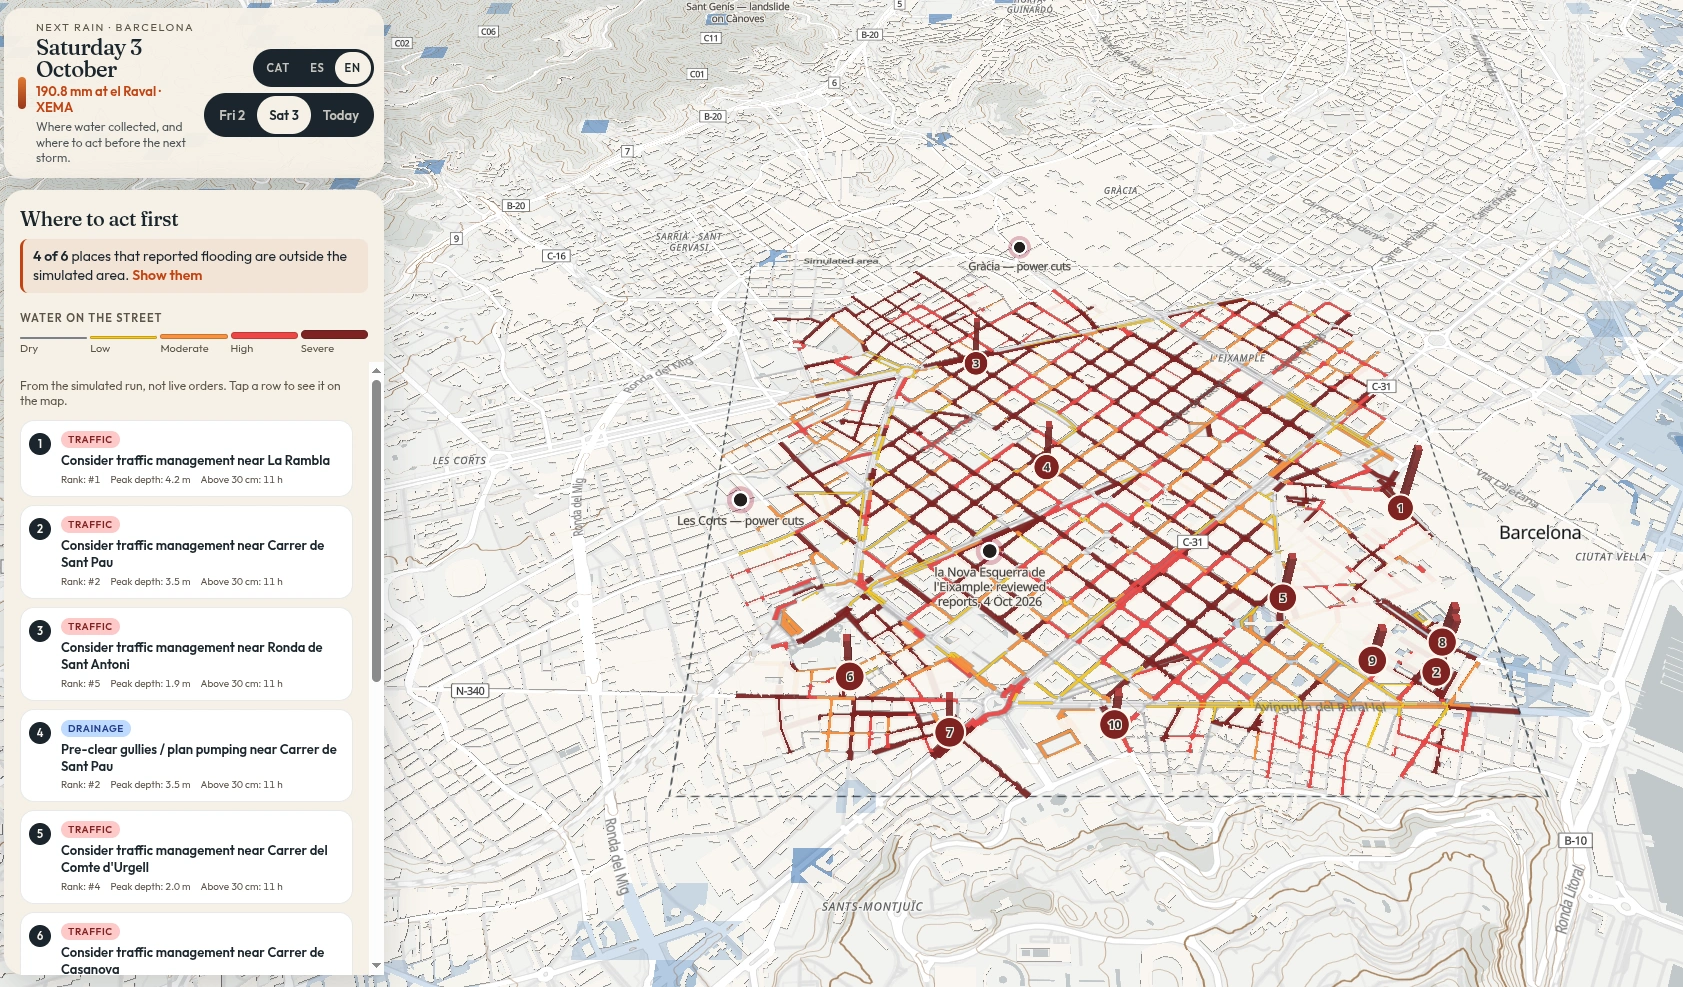
A desktop view of the city planner's perspective. Where are the hotspots?
Need a tool the public can actually use, built fast and honestly?
If you have data that matters to people and no way to put it in their hands, in their language, that is the kind of work Red Mage does. Come find me on Contra or shoot a note to andres@redmage.cc.
Full Demo Video Available Here
A full demo of functionality for this hackathon project
The situation
On Saturday 3 October 2026 a storm hit Barcelona. The weather station at el Raval recorded 190.8 mm of rain in one UTC day (143.4 mm on the local calendar day), about a third of a normal year's rain. Streets became rivers, cars were swept away and some people were trapped.
A week later, the Barcelona AI Hackathon, run by the Lytvyn.AI Foundation at Itnig Spaces, gave teams from Friday evening to Saturday afternoon to build something a stranger could use on a phone in 60 seconds. Judges scored quality, completeness, originality and how much of the work AI agents did. There was no set theme, so our team of three picked the flood.
Three readers, one map
A city planner, an emergency crew and a resident need different answers from the same data, so the app gives each one its own way in.
Planners get "where to act first": spots ranked from the simulation, each with the terrain reason water collects there.
Crews get reported impacts, each with its source and a confidence level.
Residents get a separate view that tells them what to do and where to go.
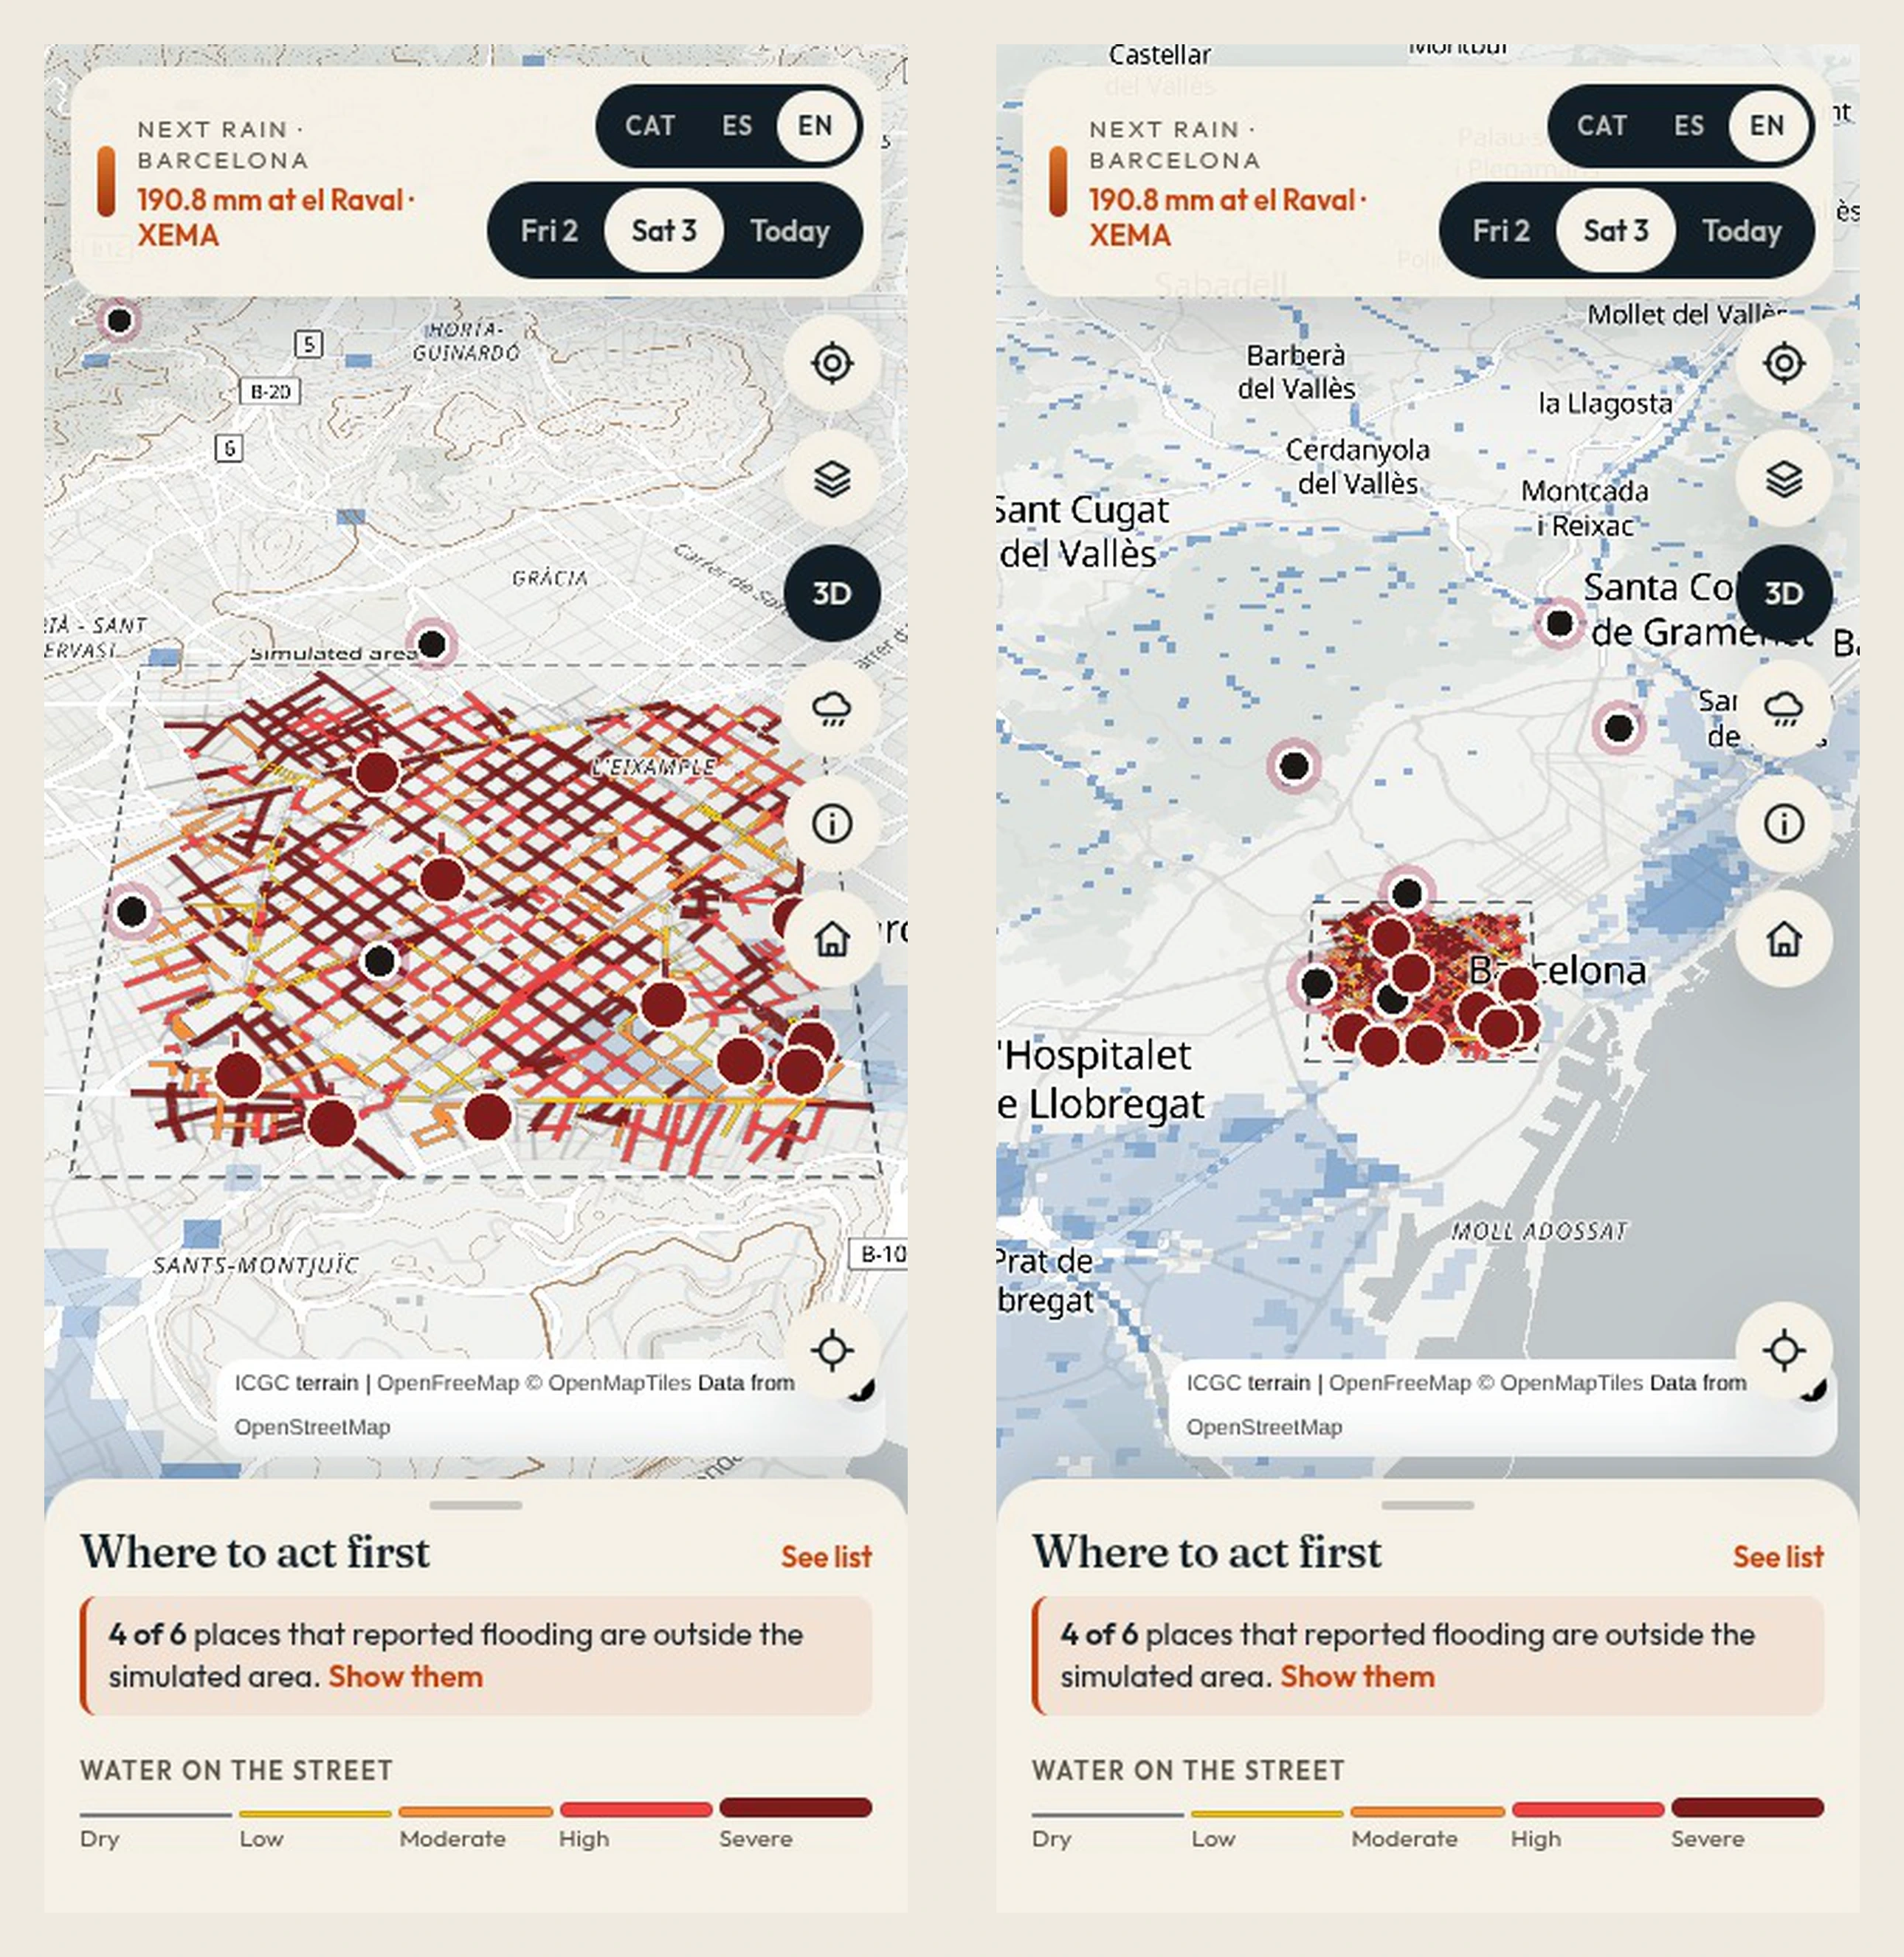
Showing where simulations work, and where they fall flat
The science
The water on the map comes from physics equations; the AI helped write the code.
The equations. The team implemented a local-inertial approximation of the 2D shallow water equations (Bates et al. 2010, in the de Almeida et al. 2012 form), the same family used in professional urban flood models. On a grid of cells, water flows across each cell face according to the slope of the water surface, slowed by friction from the ground. That friction is Manning's equation, applied semi-implicitly so it stays stable in shallow water. Each cell's depth then updates by continuity: rain in, minus what soaks into the ground, minus what the drains take, minus net flow to its neighbours.
Keeping it honest. The time step adapts to the deepest water on the grid through a CFL stability condition, and a limiter stops any cell from losing more water than it holds. After every step a ledger checks that water in minus water out equals water stored; on both storm days it balances to within 1e-13. Before touching Barcelona, the solver was checked against two textbook cases with exact answers, runoff down a tilted plane and water sloshing in a parabolic bowl, and its error shrinks as the grid gets finer.
The inputs.
Terrain: IGN's 5 m national terrain model (MDT05, from the CNIG download centre), resampled to 30 m cells. Buildings from OpenStreetMap stand as walls, so water runs down the streets between them.
Ground cover: OpenStreetMap land use, turned into a roughness value per cell and into Green-Ampt infiltration parameters from the Rawls et al. (1983) soil tables. Parks soak water up; asphalt almost none.
Rain: Meteocat's XEMA weather stations, spread across the grid by inverse-distance weighting.
Drains: Barcelona's sewer capacities are not public, so drainage is a labelled assumption, swept at 0, 10, 20 and 30 mm an hour, and the app shows the range.
Why a street floods. For each hotspot, the app explains the ground: how much land drains toward it (D8 flow accumulation), whether it sits in a hollow (depression depth from a priority-flood fill of the terrain), and how steep it is.
What-if in under a second. The physics takes hours per storm. To answer "what if 75 mm fell and the drains cleared 10 mm an hour", the team trained a gradient-boosted tree model (scikit-learn) on the simulation's output. Its features are all terrain: elevation, slope, flow accumulation, topographic wetness index, depression depth, and distance to the sea and to Barcelona's buried streams. It was tested with spatial cross-validation, holding out whole 500 m neighbourhoods so nearby near-copies cannot flatter the score, and its probabilities were calibrated with isotonic regression into risk bands. It scores 15 rain and drain combinations and reports its own trust level.
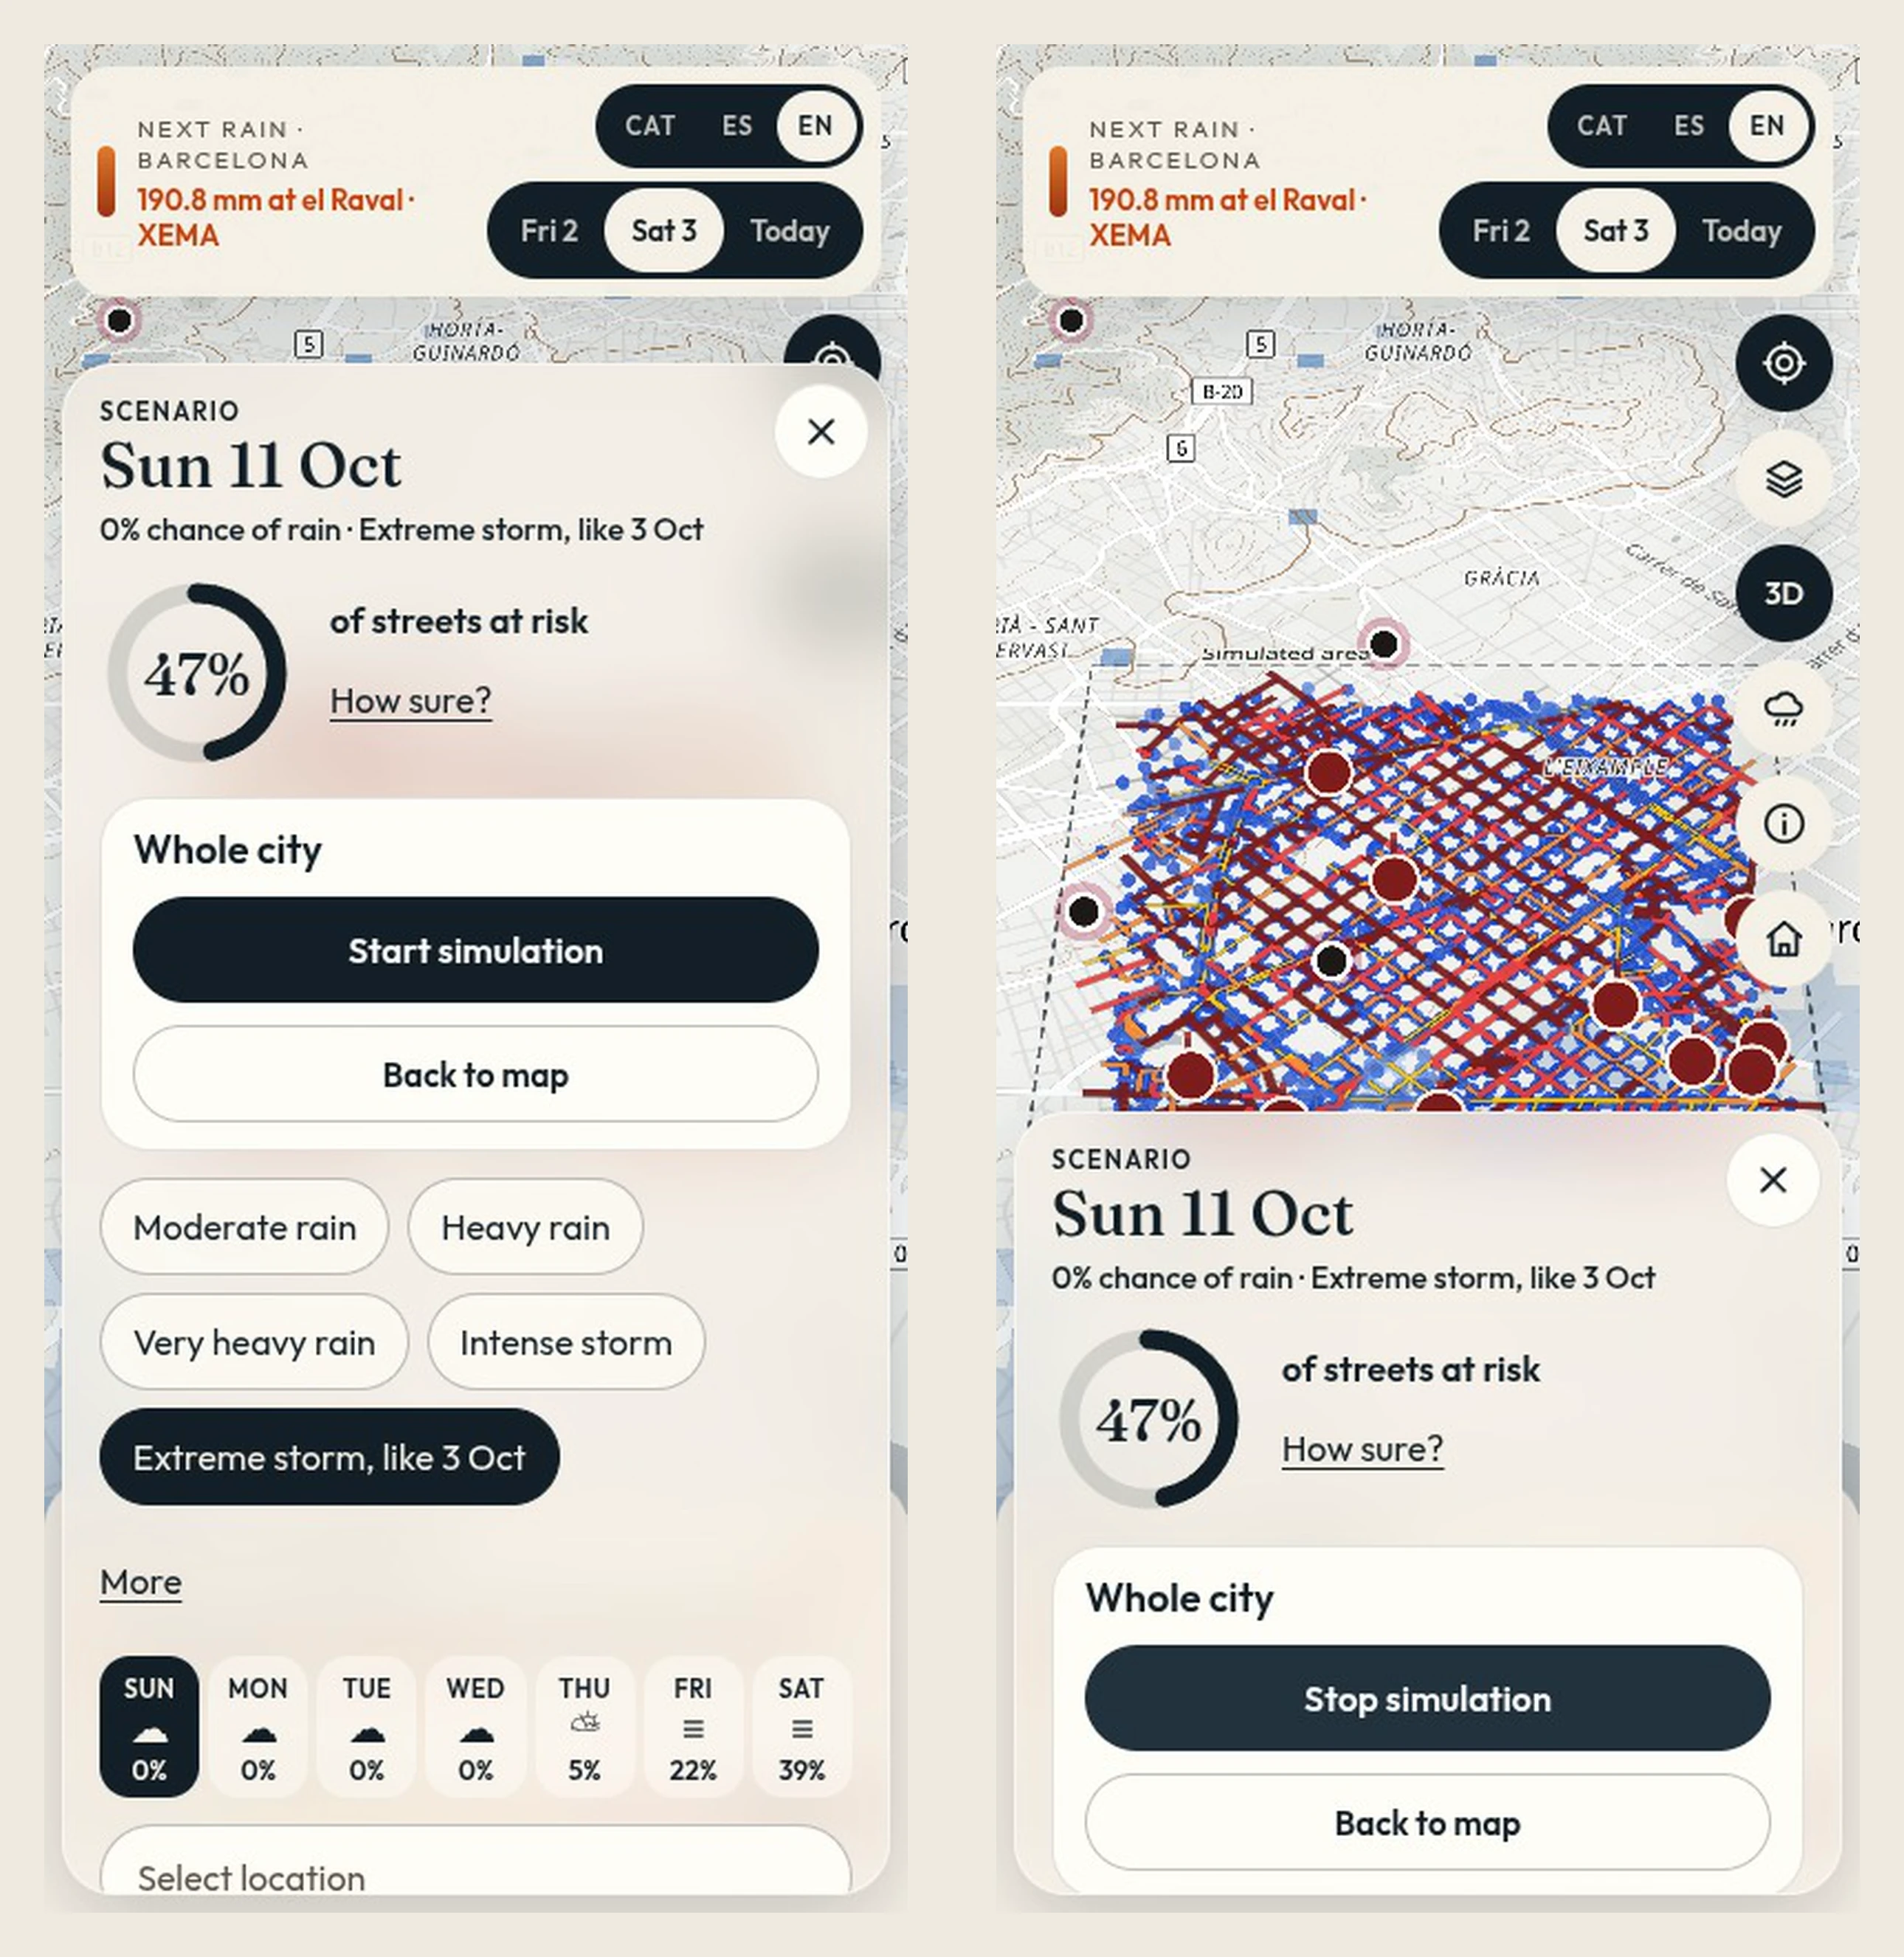
Simulation of the flooding using gradient-boosted prediction
The reports
The simulation covers a 3.2 km box over the Raval, Sant Antoni, Sants and the Eixample. I built the layer that shows what happened everywhere else: a pipeline that reads the Ajuntament's press feed and betevé's news feed, matches each item to one of the city's 73 neighbourhoods, and queues it for a person to approve. Nothing reaches the map without that review.
The rules it runs on:
Only named organisations become rows. Posts by individuals on Reddit, Instagram, TikTok, X and Telegram are blocked in code, even if someone adds them by mistake.
Places come from the neighbourhood list, never from a model guess.
Anything about health or injuries is dropped before it is saved.
Each report carries a confidence level set by who published it: high for the responsible body, medium for the press.
I also wrote the script that compares the model's hotspots with the reported places. That gave the demo its main finding: four of the six reported flood places sat outside the simulated box, in Torre Baró and Sant Genís up in the hills and in Sant Andreu to the northeast. The model was looking at the centre while the hills flooded, and the app now says so on the map.
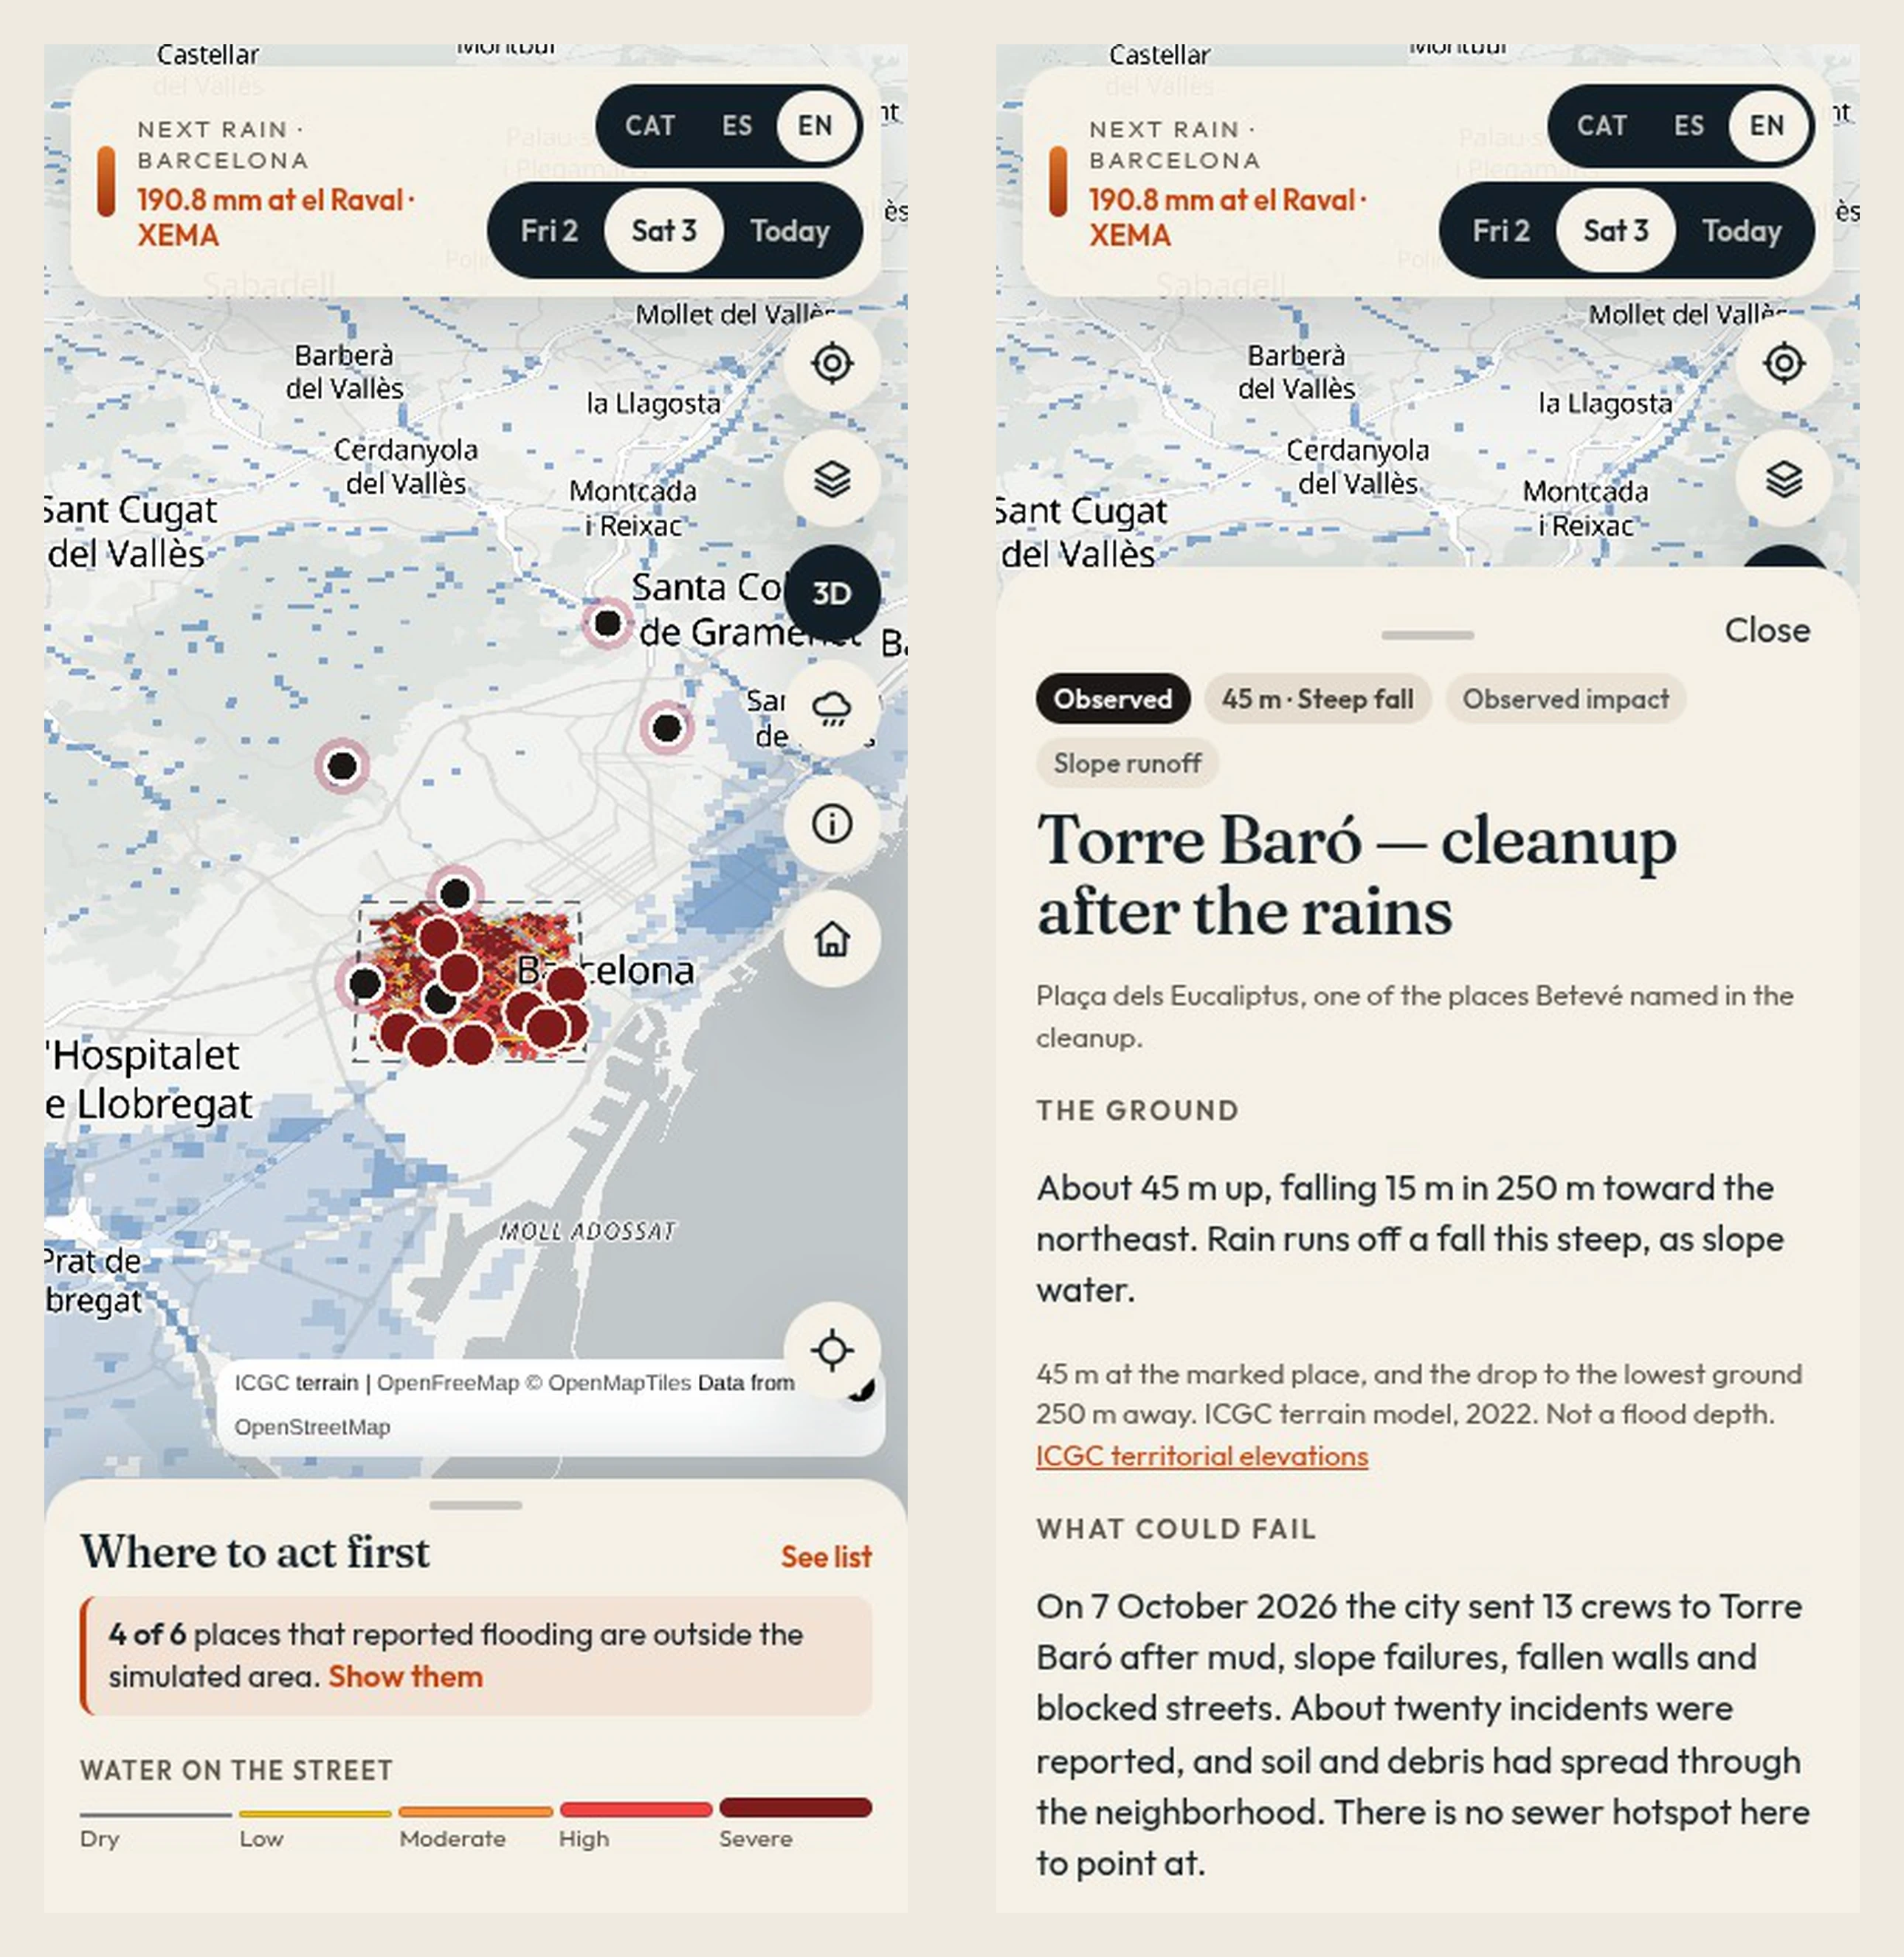
Press and city reports show what happened outside the simulation.
The resident view and the app
A person standing in the rain needs to know what to do, so I built the resident view to lead with that.
Tap La Rambla and it says the water reached above the knee near there. Then it says where to go: up, to an upper floor and away from basements, garages and underpasses, which is the city's own plan for street flooding. It names the low streets nearby to keep away from, the metro entrances and roads that shut within 1.5 km during the October storm, and the numbers to call. If 112 or Protecció Civil tell you to leave, follow them. Tap Torre Baró and it says the model has not covered that area yet, next to the city's report from that street. The resident sees the same blind spot the city does.
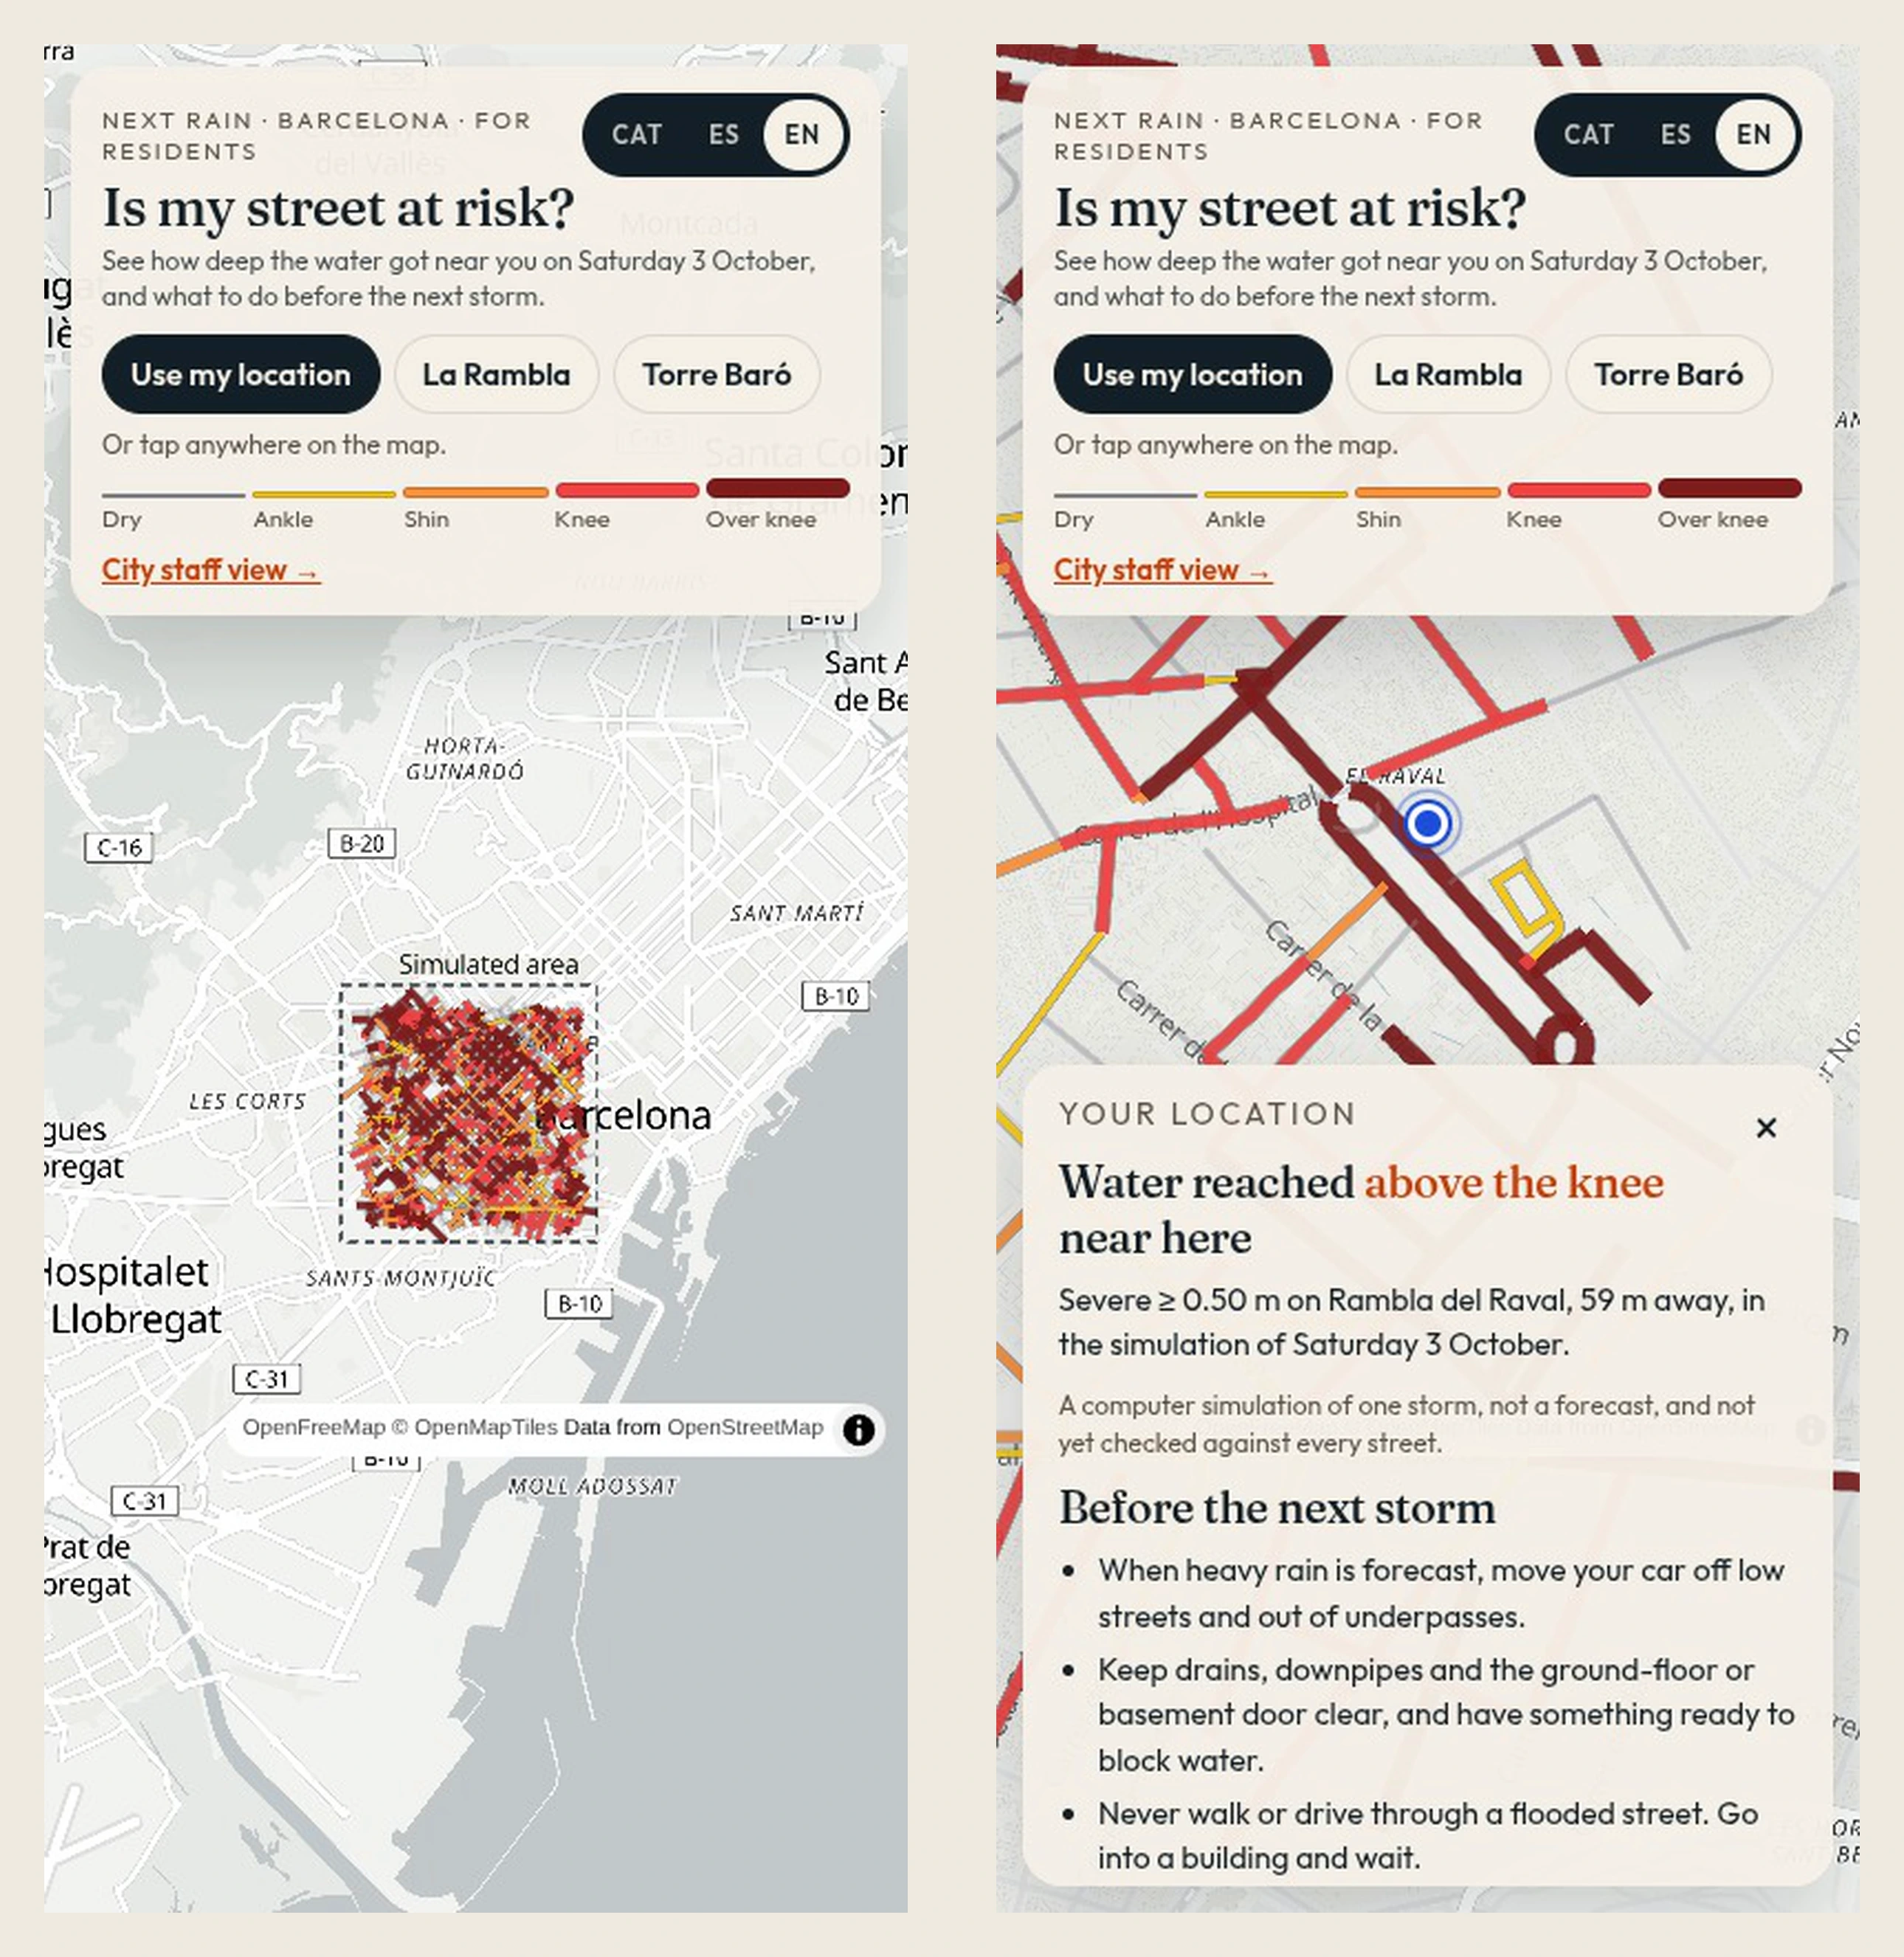
the resident view; simple and not heavy on the phone to load as much as needed as quickly as possible.
Around it, I built:
The Catalan, Spanish and English switch, across every panel and data source.
Flood depth shown by line width and a dark edge as well as colour, with a legend that tells screen readers so.
The map-first layout with a bottom sheet, a 3D view with official ICGC contour lines, and a live tab of half-hourly XEMA station readings.
The Netlify deploy, and the service worker that keeps the app and the parts of the map already seen working without a connection. That matters in a storm.
The front end is Vite, React and MapLibre on an OpenFreeMap basemap, with no backend: everything ships as a static site.
How we used AI
Three of us, three different agent setups, among them GrokBot, Claude Desktop and T3 Code. The model build used five agents with one job each: data, physics, an independent checker, the backend, and a map tester. My share ran through Claude Code.
What held it together was Reliquary, a shared context vault I build: the research, data notes and rules lived in one place that every person's agents could read, so nobody's assistant was working from a stale copy.
What the audit caught
On Saturday a separate audit of the model found what the build-time checks had missed. The maths was sound, but the simulated box had closed walls, so water that should have drained downhill toward the sea piled up against its edge. By midnight 56% of the day's rain was still sitting in the box, and La Rambla showed 4.17 m of water. Checked against the city's own flood atlas, the hotspots matched about as often as random points would, with only seven reference points inside the box, too few to say either way.
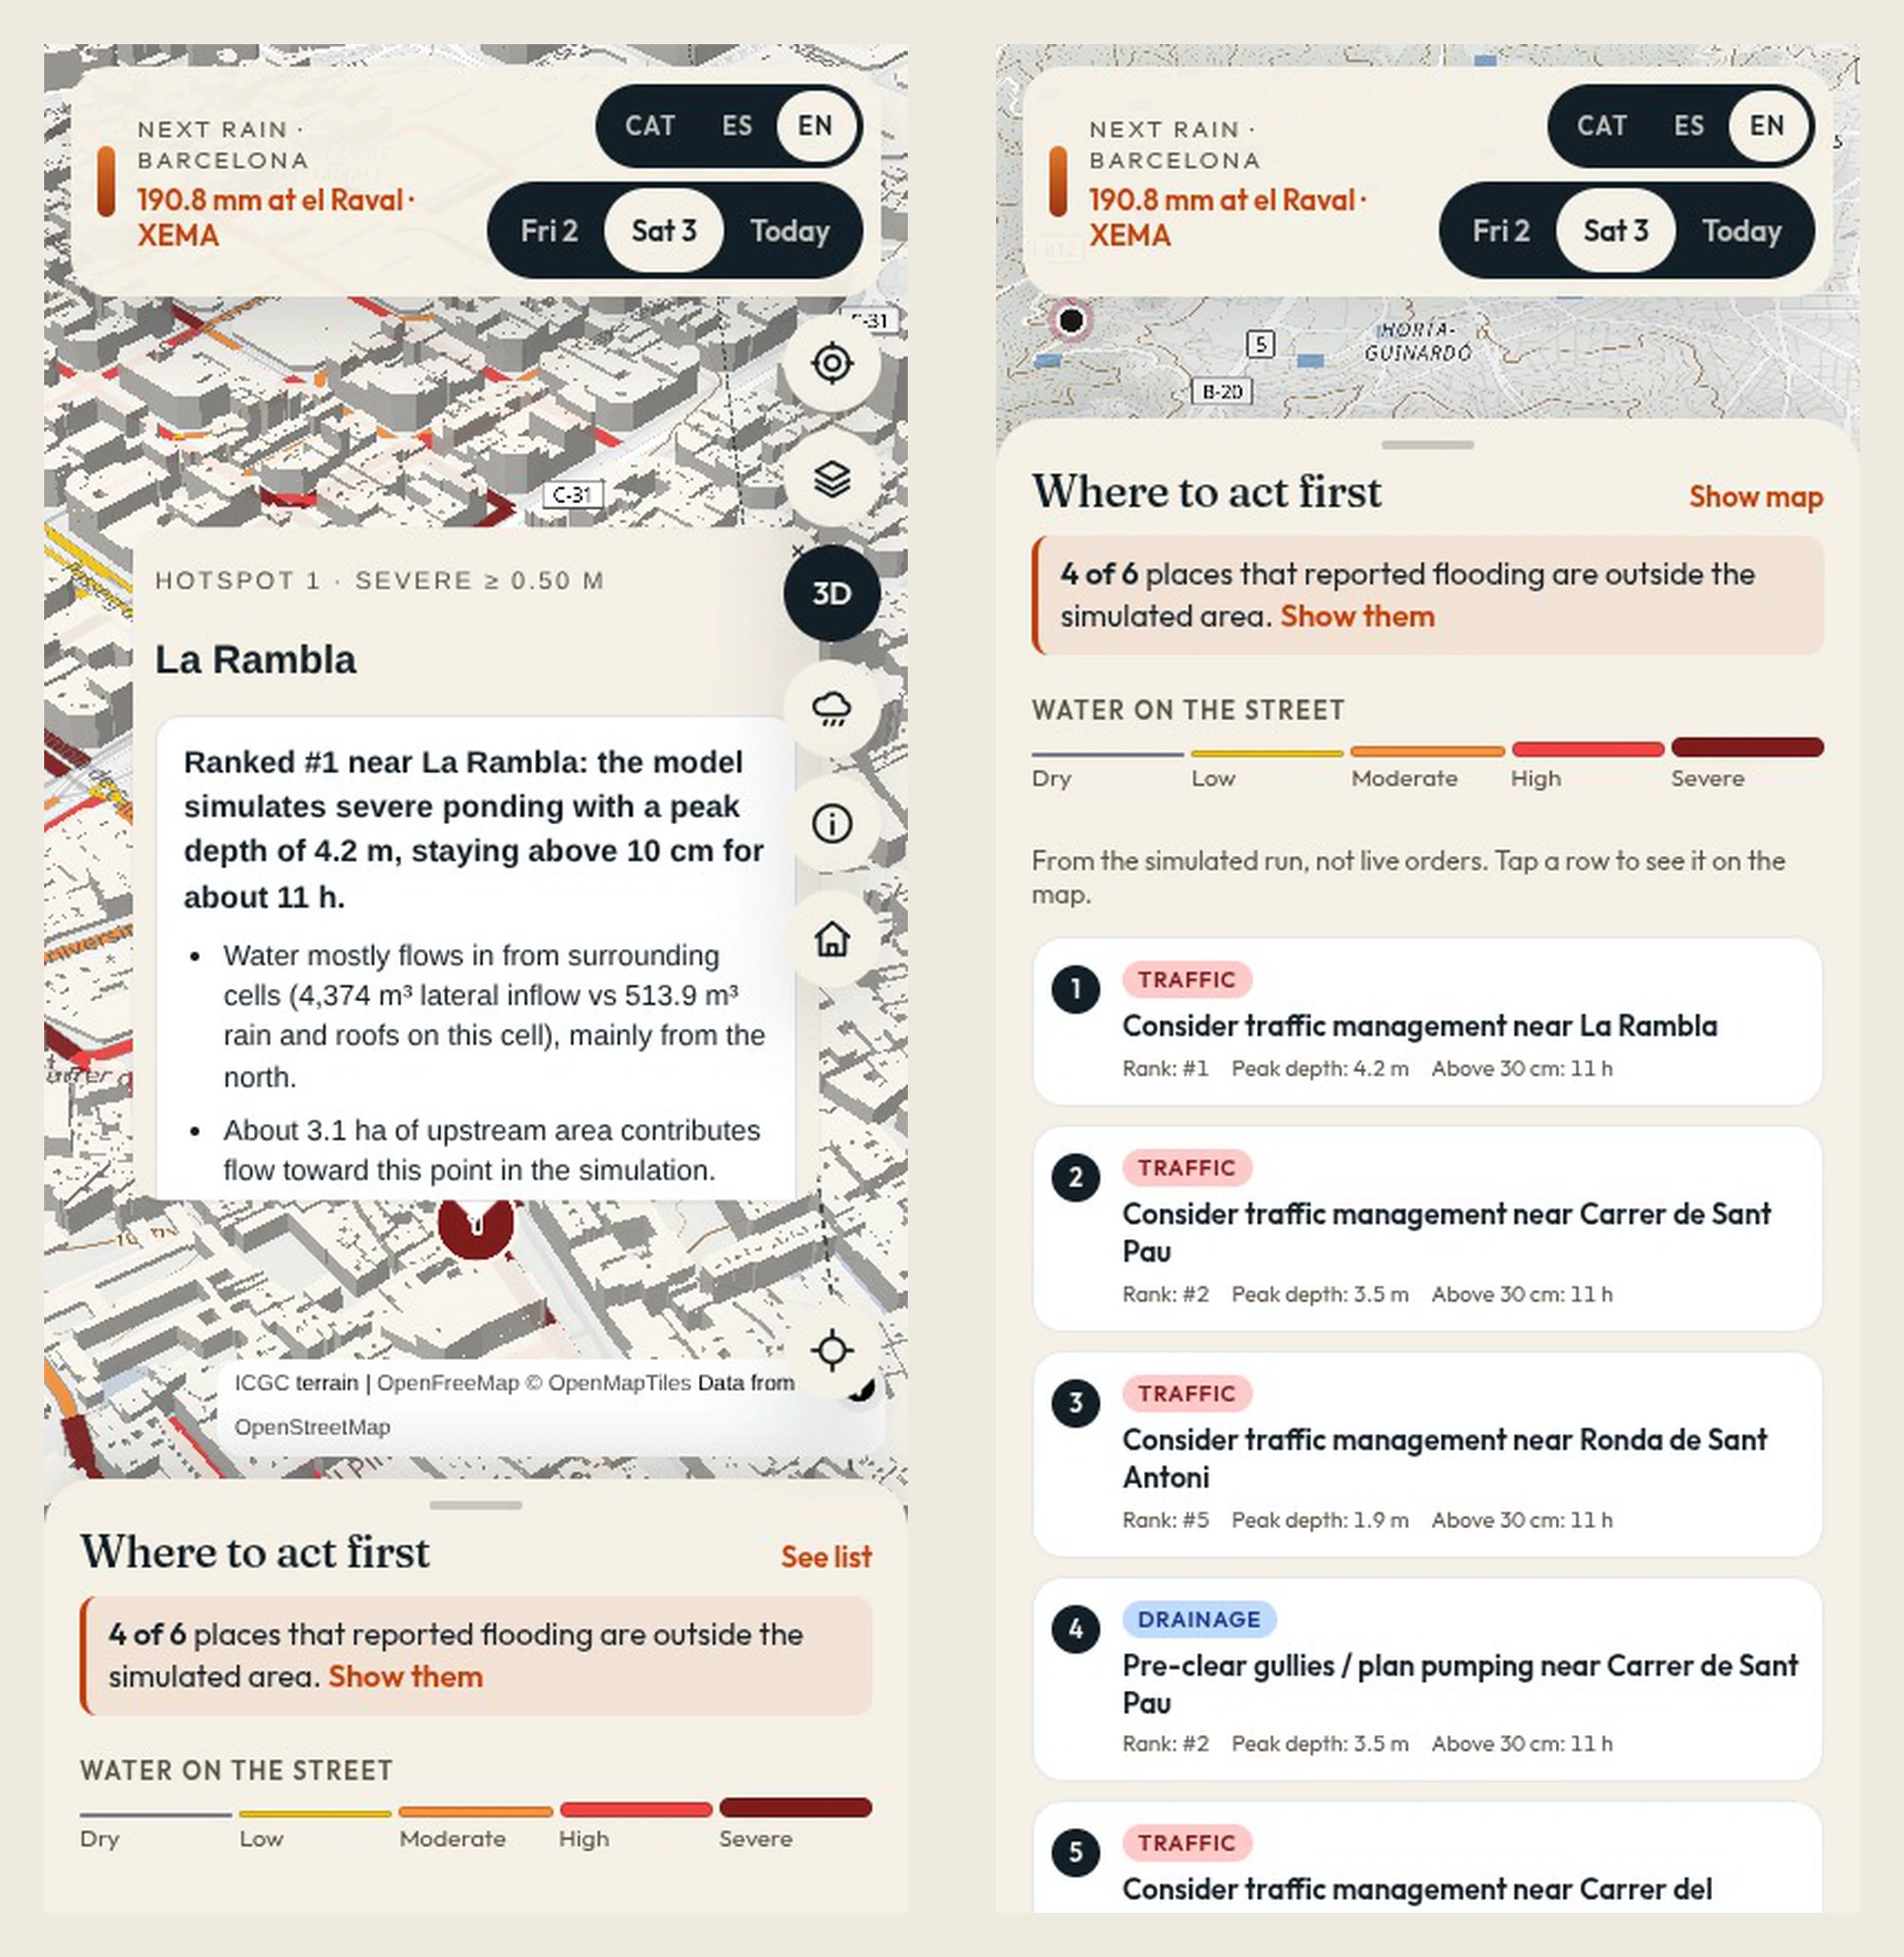
I can attest; La Rambla was a mess that day, 4m deep being the deepest point in the area but realistically showing around 10cm across 11 hours.
With hours left before code freeze, rebuilding was out, so the team changed what the map claims:
I took precision the model could not back off the screen, and added the count of reported places the simulation misses.
Hotspots near the box edge carry a badge saying their depth is an upper bound.
The what-if model was retrained without those edge rows.
The app labels the map "a computer simulation of one storm, not a forecast".
One dataset we did not get: the Catalan government's official flood zones. Its map server blocks automated downloads, and we left it at that.
Where it would go next
As a real product, Next Rain belongs to a city or a civil protection service, and four things stand between the demo and that:
Open edges and the whole city. Rerun the model with water free to leave the box, then across the full metro area, starting where the reports say the water was.
A baseline to beat. Score the physics against a terrain-only model (height above nearest drainage and wetness index from the same height map), using every known flood point in the city. If the physics does not beat it, it does not earn its complexity.
Drain data. The single biggest unknown. A data agreement with the city's water operator, BCASA, would replace four guesses with one measurement.
The alert. When the city sends its emergency flood alert, it links to the resident view. One tap, and you see which streets near you are flooding and how to get away from the water.
Need a tool the public can actually use, built fast and honestly?
If you have data that matters to people and no way to put it in their hands, in their language, that is the kind of work Red Mage does. Come find me on Contra or shoot a note to andres@redmage.cc.
Sources
Methods
Bates, P. D., Horritt, M. S., Fewtrell, T. J. (2010). A simple inertial formulation of the shallow water equations for efficient two-dimensional flood inundation modelling. Journal of Hydrology 387. doi:10.1016/j.jhydrol.2010.03.027
de Almeida, G. A. M., Bates, P., Freer, J. E., Souvignet, M. (2012). Improving the stability of a simple formulation of the shallow water equations for 2-D flood modeling. Water Resources Research 48. doi:10.1029/2011WR011570
Rawls, W. J., Brakensiek, D. L., Miller, N. (1983). Green-Ampt infiltration parameters from soils data. Journal of Hydraulic Engineering 109(1). doi:10.1061/(ASCE)0733-9429(1983)109:1(62)
USDA-SCS (1986). Urban Hydrology for Small Watersheds, TR-55, Table 3-1, Manning's n for sheet flow.
O'Callaghan, J. F., Mark, D. M. (1984). The extraction of drainage networks from digital elevation data. Computer Vision, Graphics, and Image Processing 28. doi:10.1016/S0734-189X(84)80011-0
Barnes, R., Lehman, C., Mulla, D. (2014). Priority-flood: an optimal depression-filling and watershed-labeling algorithm for digital elevation models. Computers & Geosciences 62. doi:10.1016/j.cageo.2013.04.024
Rennó, C. D. et al. (2008). HAND, a new terrain descriptor using SRTM-DEM. Remote Sensing of Environment 112. doi:10.1016/j.rse.2008.03.018
Data
Terrain: IGN MDT05, 5 m.
Rain: Meteocat XEMA stations, via Catalonia's open data portal.
Buildings and land use: OpenStreetMap contributors.
Contours: ICGC.
Reference flood points: Barcelona's Resilience Atlas and the RESCCUE project.
Reported impacts: Ajuntament de Barcelona press room and betevé.
Like this project
Posted Oct 12, 2026
A phone map of the 3 October 2026 storm in Barcelona: a physics flood simulation of the city centre for city planners, first responders and residents. CAT/ES/EN
Likes
0
Views
0
Timeline
Oct 9, 2026 - Oct 10, 2026