US Billboard Inventory Scraper: Lamar Advertising Panels Across
Portfolio project

A Python data pipeline that pulls the complete outdoor advertising inventory from Lamar.com, one of the largest billboard companies in the US, and turns it into clean, analysis-ready Excel files, one per state.
The Challenge
The client needed detailed billboard data across multiple US markets for media planning and pricing analysis. Lamar’s inventory sits behind an interactive map, so collecting it by hand across thousands of locations wasn’t practical.
States Covered
Florida
Texas
California
Arizona
Ohio
Georgia
Tennessee
Louisiana
North Carolina
South Carolina
My Approach
Reverse-engineered the internal inventory API instead of scraping page by page. The data came back as clean JSON, which was faster and more reliable.
Collected panel IDs per state from the map’s structure data, then pulled the full details for each panel.
Built a resumable batch queue. IDs are processed in small batches and removed from the queue as they finish, so the job can stop and restart without losing progress or creating duplicates.
Added retry and error handling. Failed requests are retried automatically, and missing panels are logged separately for review.
Normalized everything into a consistent schema across all 10 states.
Data Delivered (15 fields per panel)
Geopath ID and panel number
Full address and GPS coordinates (latitude/longitude)
Weekly impressions
Rate
Media type: bulletin, poster, digital or tri-vision
Panel size and vinyl size
Facing direction and read side (left or right of road)
Illumination status
Location selling points (traffic, nearby businesses, commuter routes)
Key Insights from the Data
100% GPS coverage. Every panel has latitude and longitude, ready for mapping.
7 media formats captured: permanent bulletins (44%), posters (34%), transit shelters (10%), junior bulletins, junior posters, rotary bulletins and digital boards.
67% of panels are illuminated, so they’re visible around the clock.
Weekly impressions reach up to 1.87 million per panel, with a typical panel at about 89,000.
Published rates range from $850 to $2,000 for most panels, and premium locations go up to $16,000.
74% of panels include location selling-point notes for media buyers.
South Carolina, Georgia and Florida had the highest median weekly impressions of the 10 states.
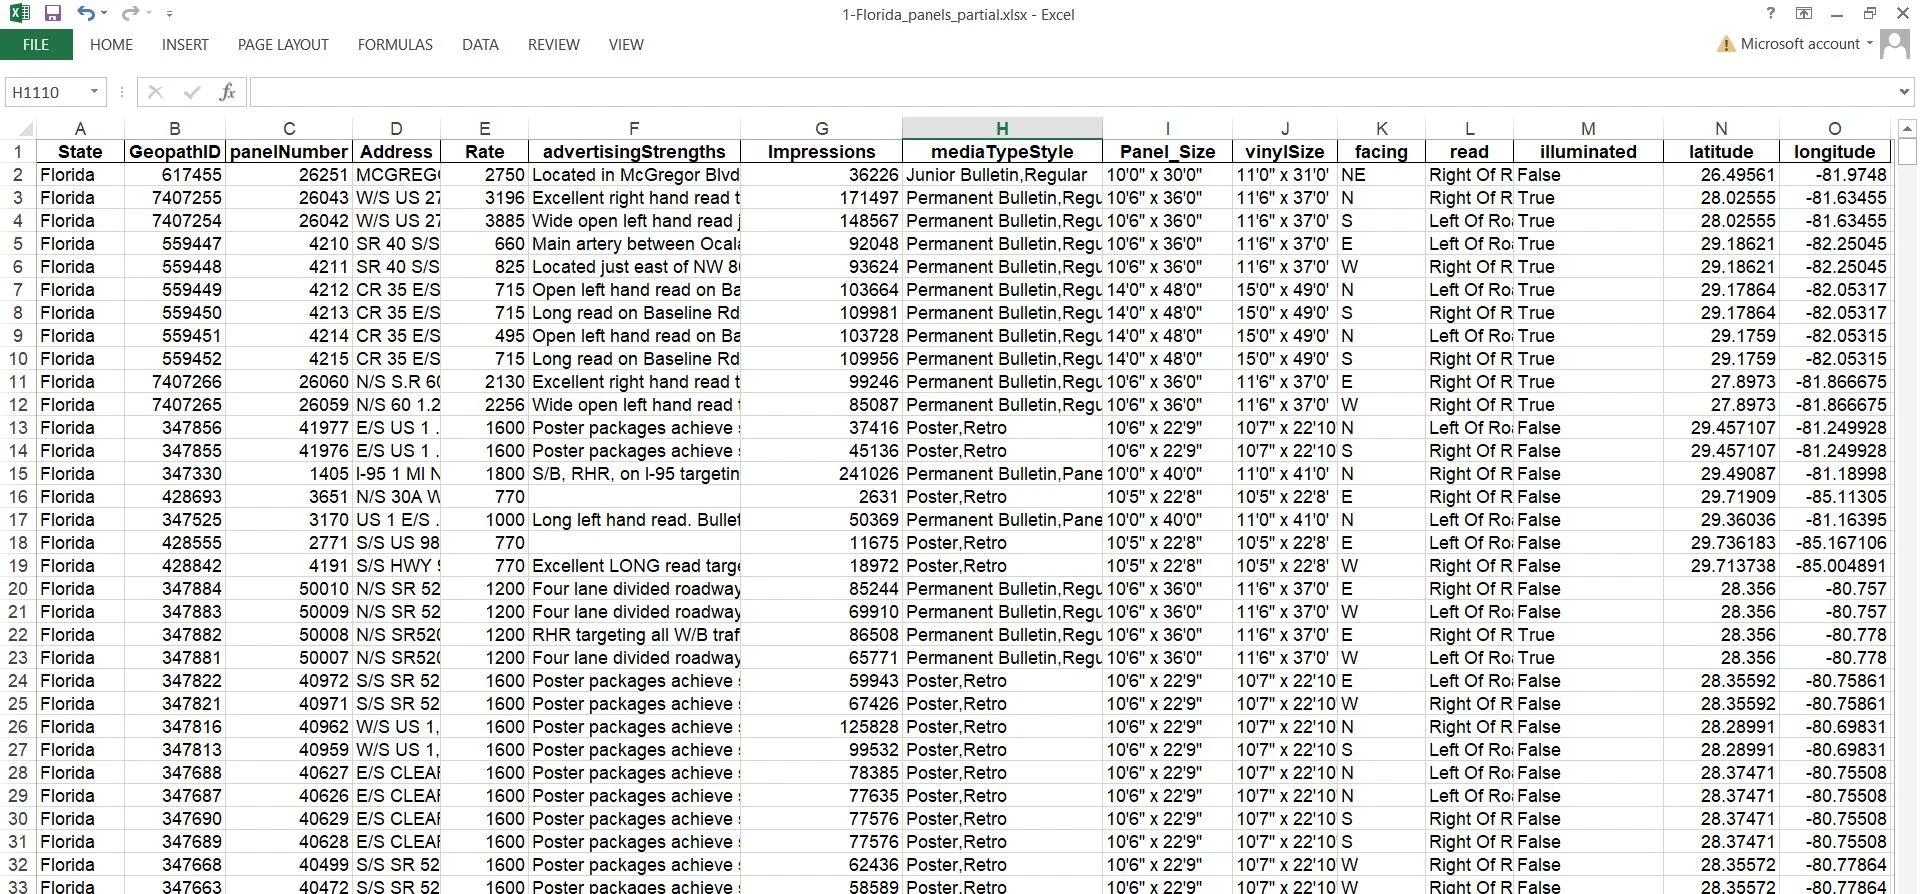
Florida Advertising Panels list
Results
Complete inventory for 10 states, delivered as separate structured Excel files
Ready for mapping, market comparison, media planning, and price analysis
A reusable pipeline: adding a new state means changing one input
Tech Stack
Python · Requests · Pandas · JSON · REST API reverse engineering · Excel
1 like · 2 views · Nov 10, 2026
Reverse-engineered Lamar.com’s inventory API in Python to extract billboard data across 10 US markets into clean Excel files with 15 fields per panel.


