AI Dashboard: Conceptual UI Design
Victoria Tng
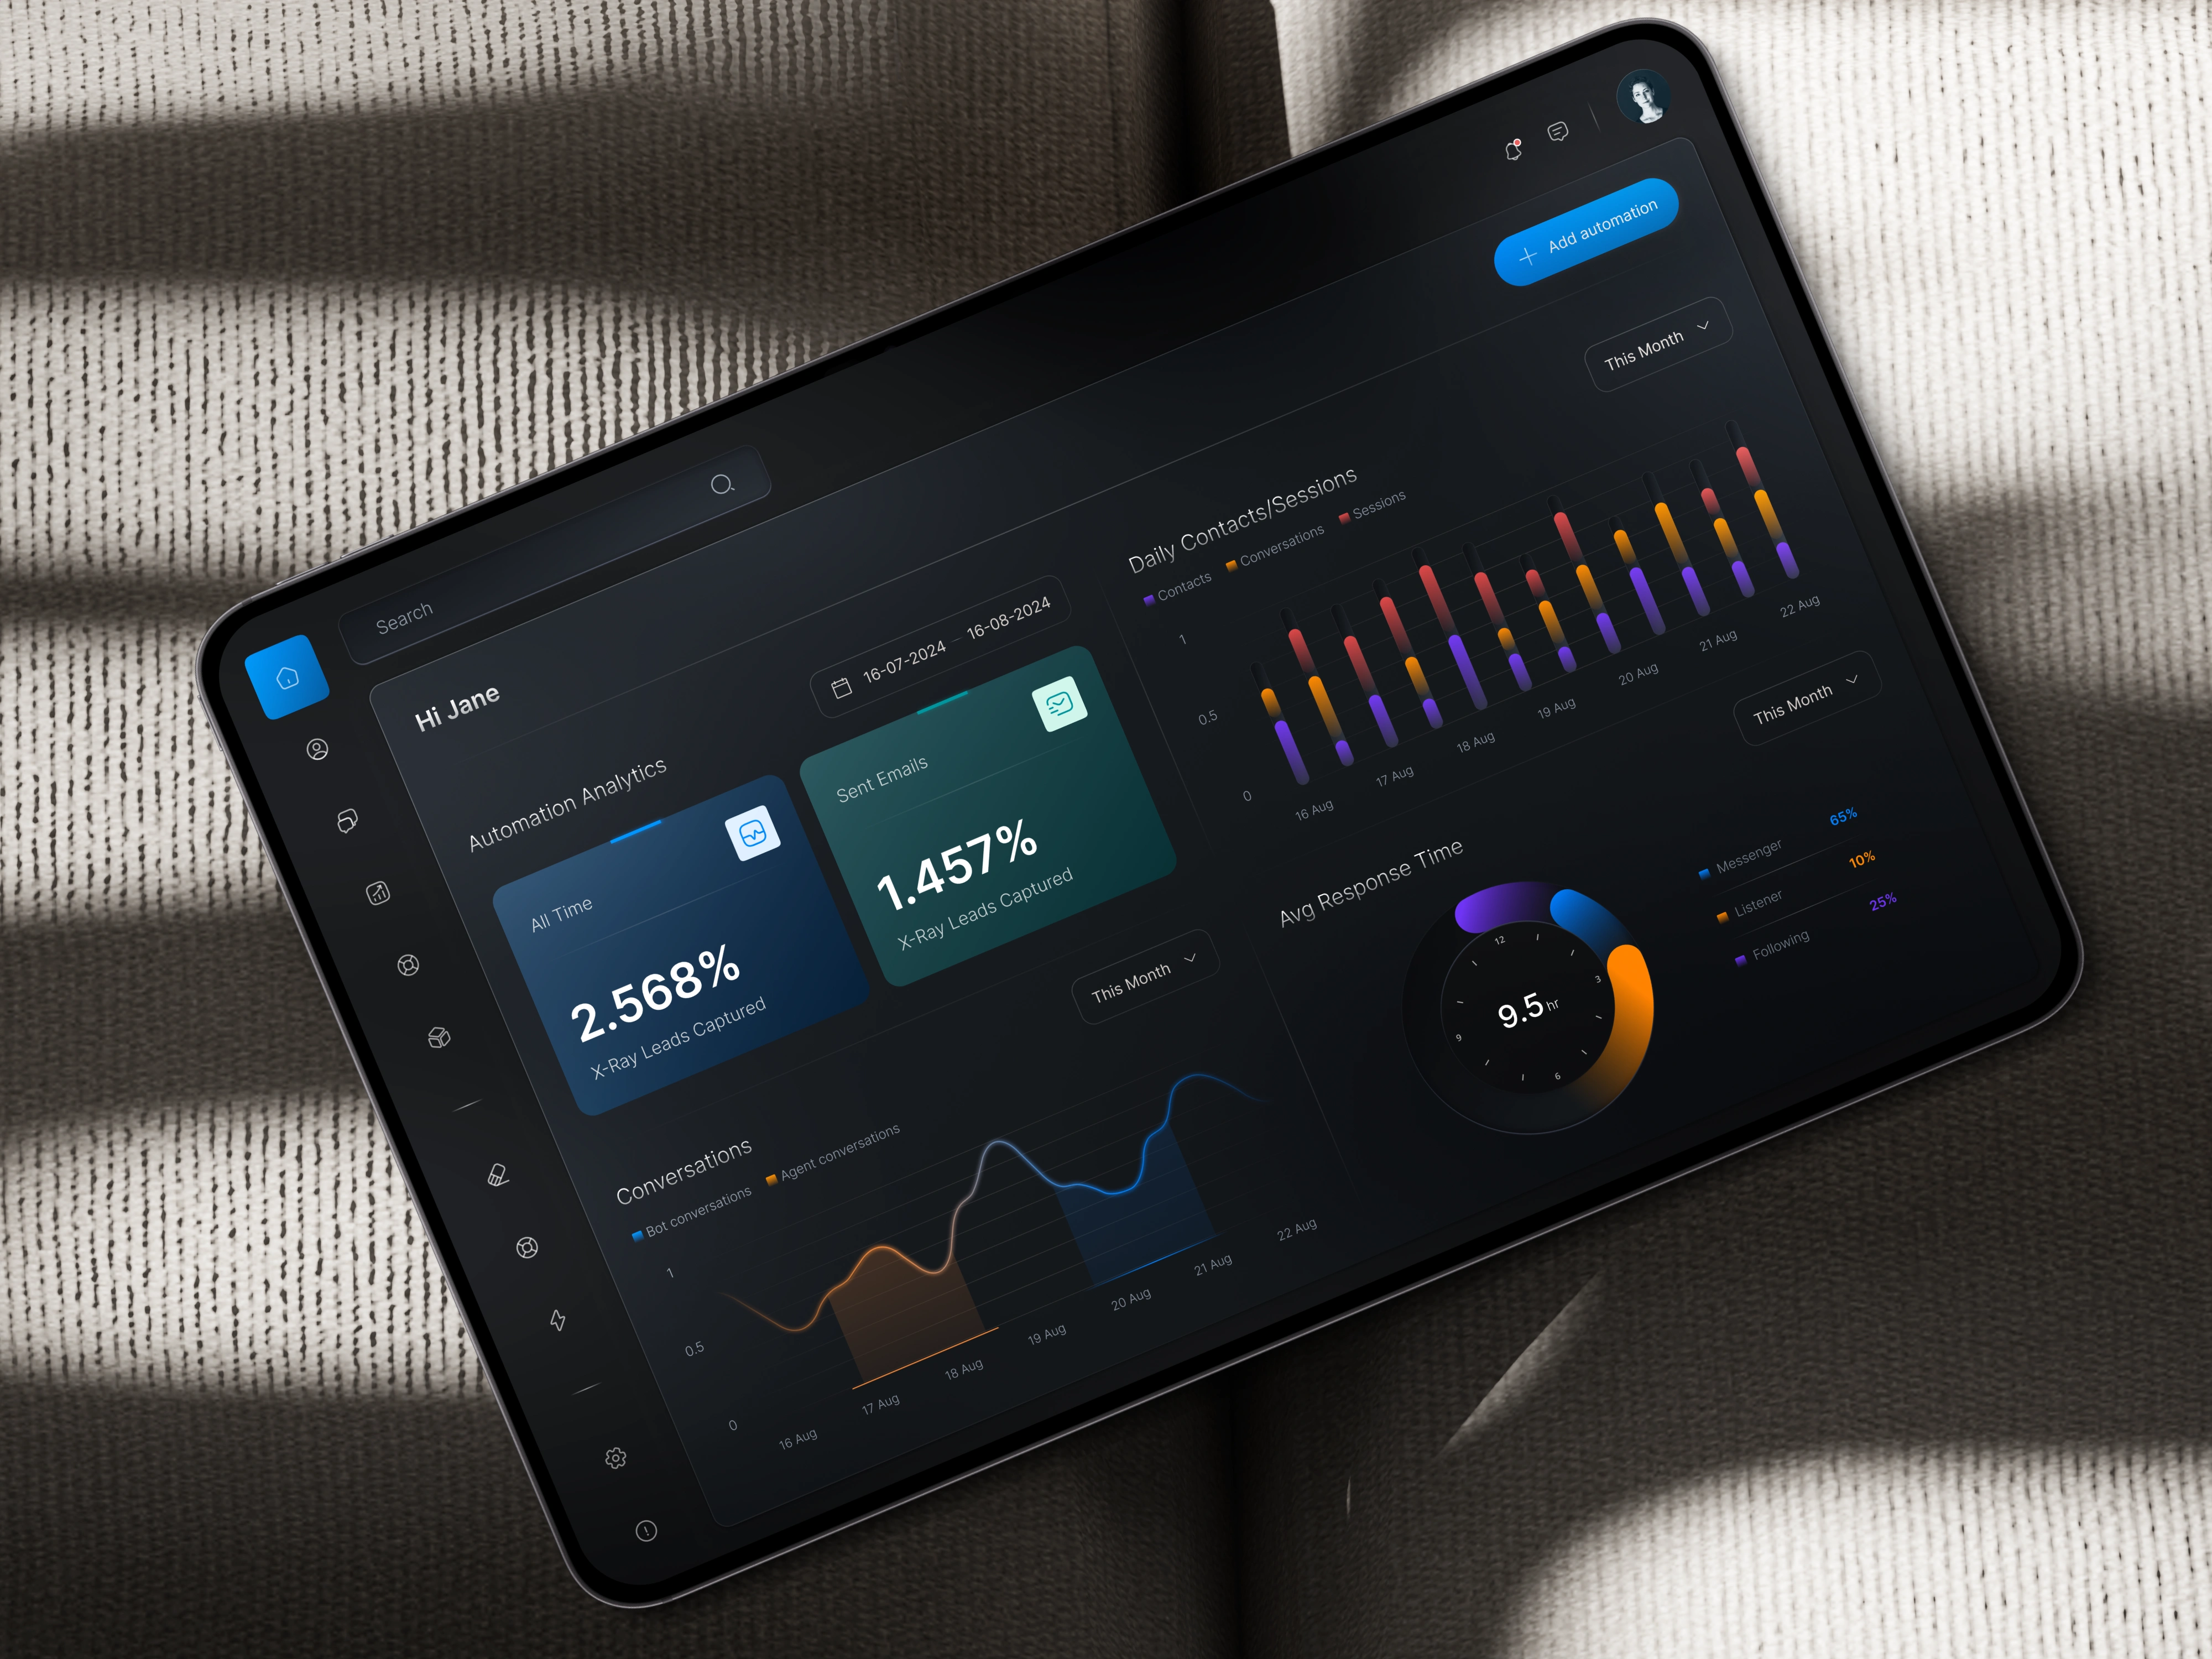
AI Dashboard represents a conceptual UI design focused on centralizing and visualizing key metrics. The home dashboard is designed to provide a streamlined view of essential data with intuitive widgets.
Conceptual UI Widgets
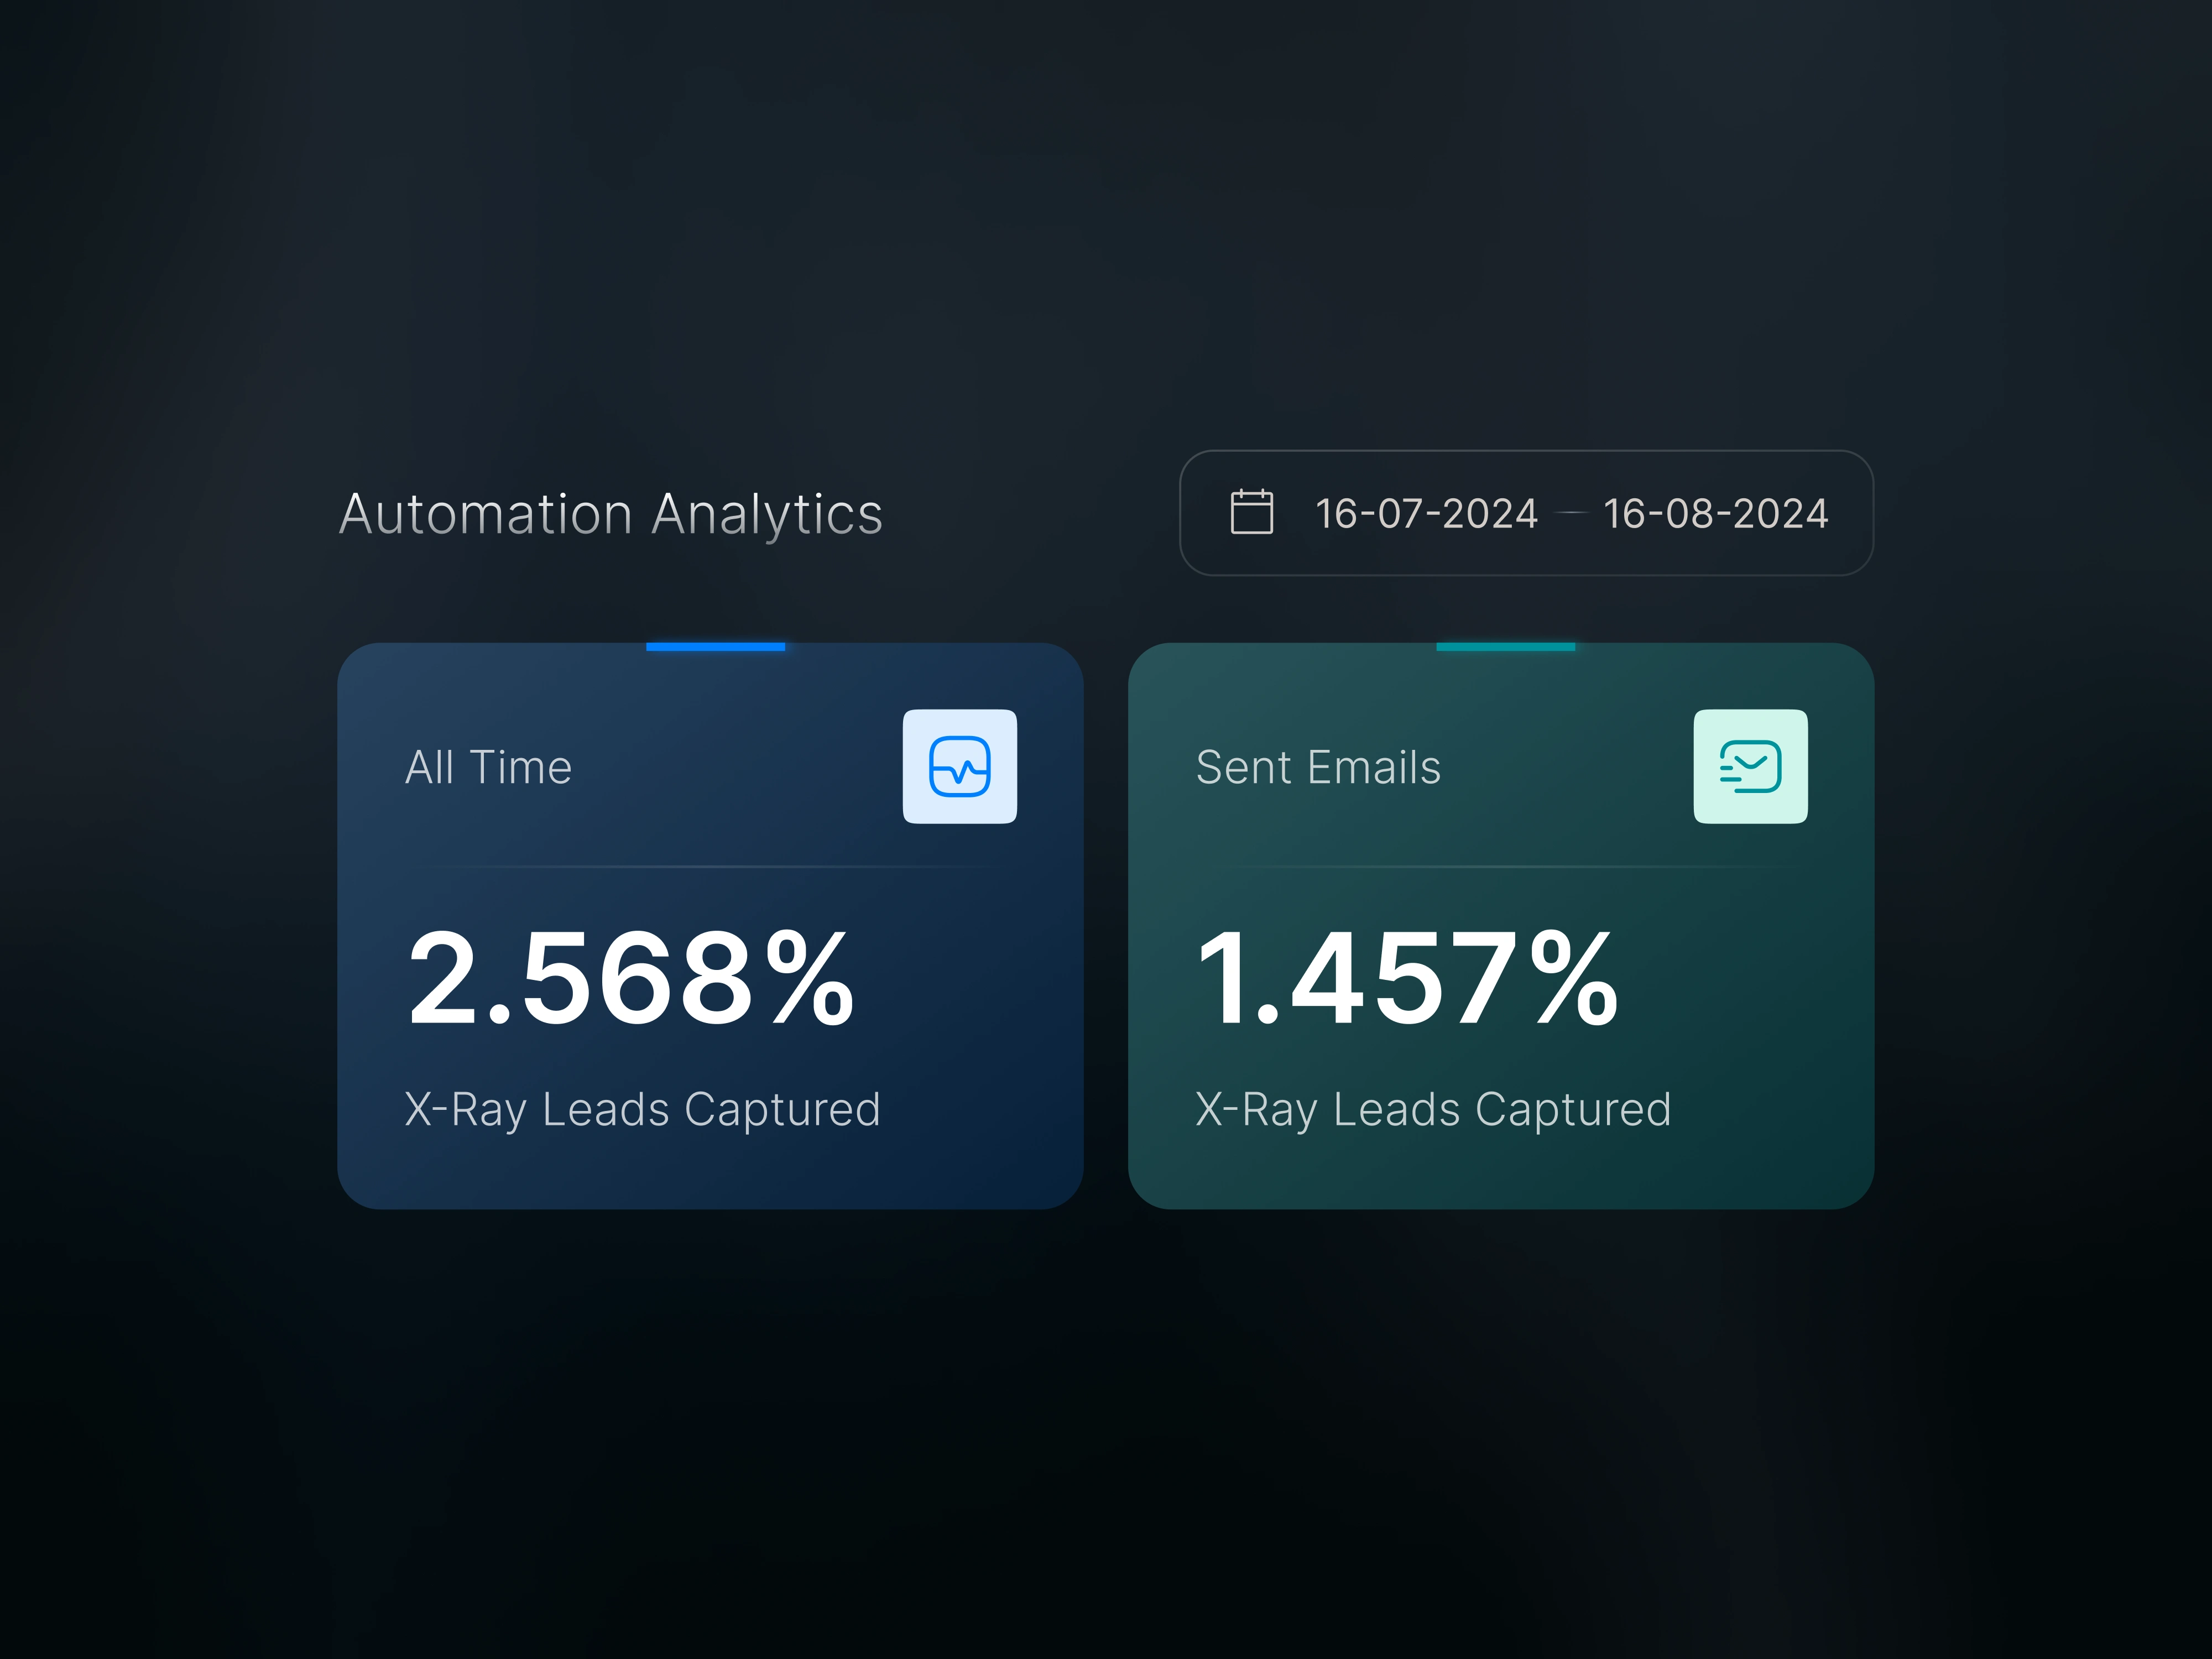
Automation Analytics
Visualizes performance metrics and trends for automated processes, offering insights into efficiency and effectiveness.
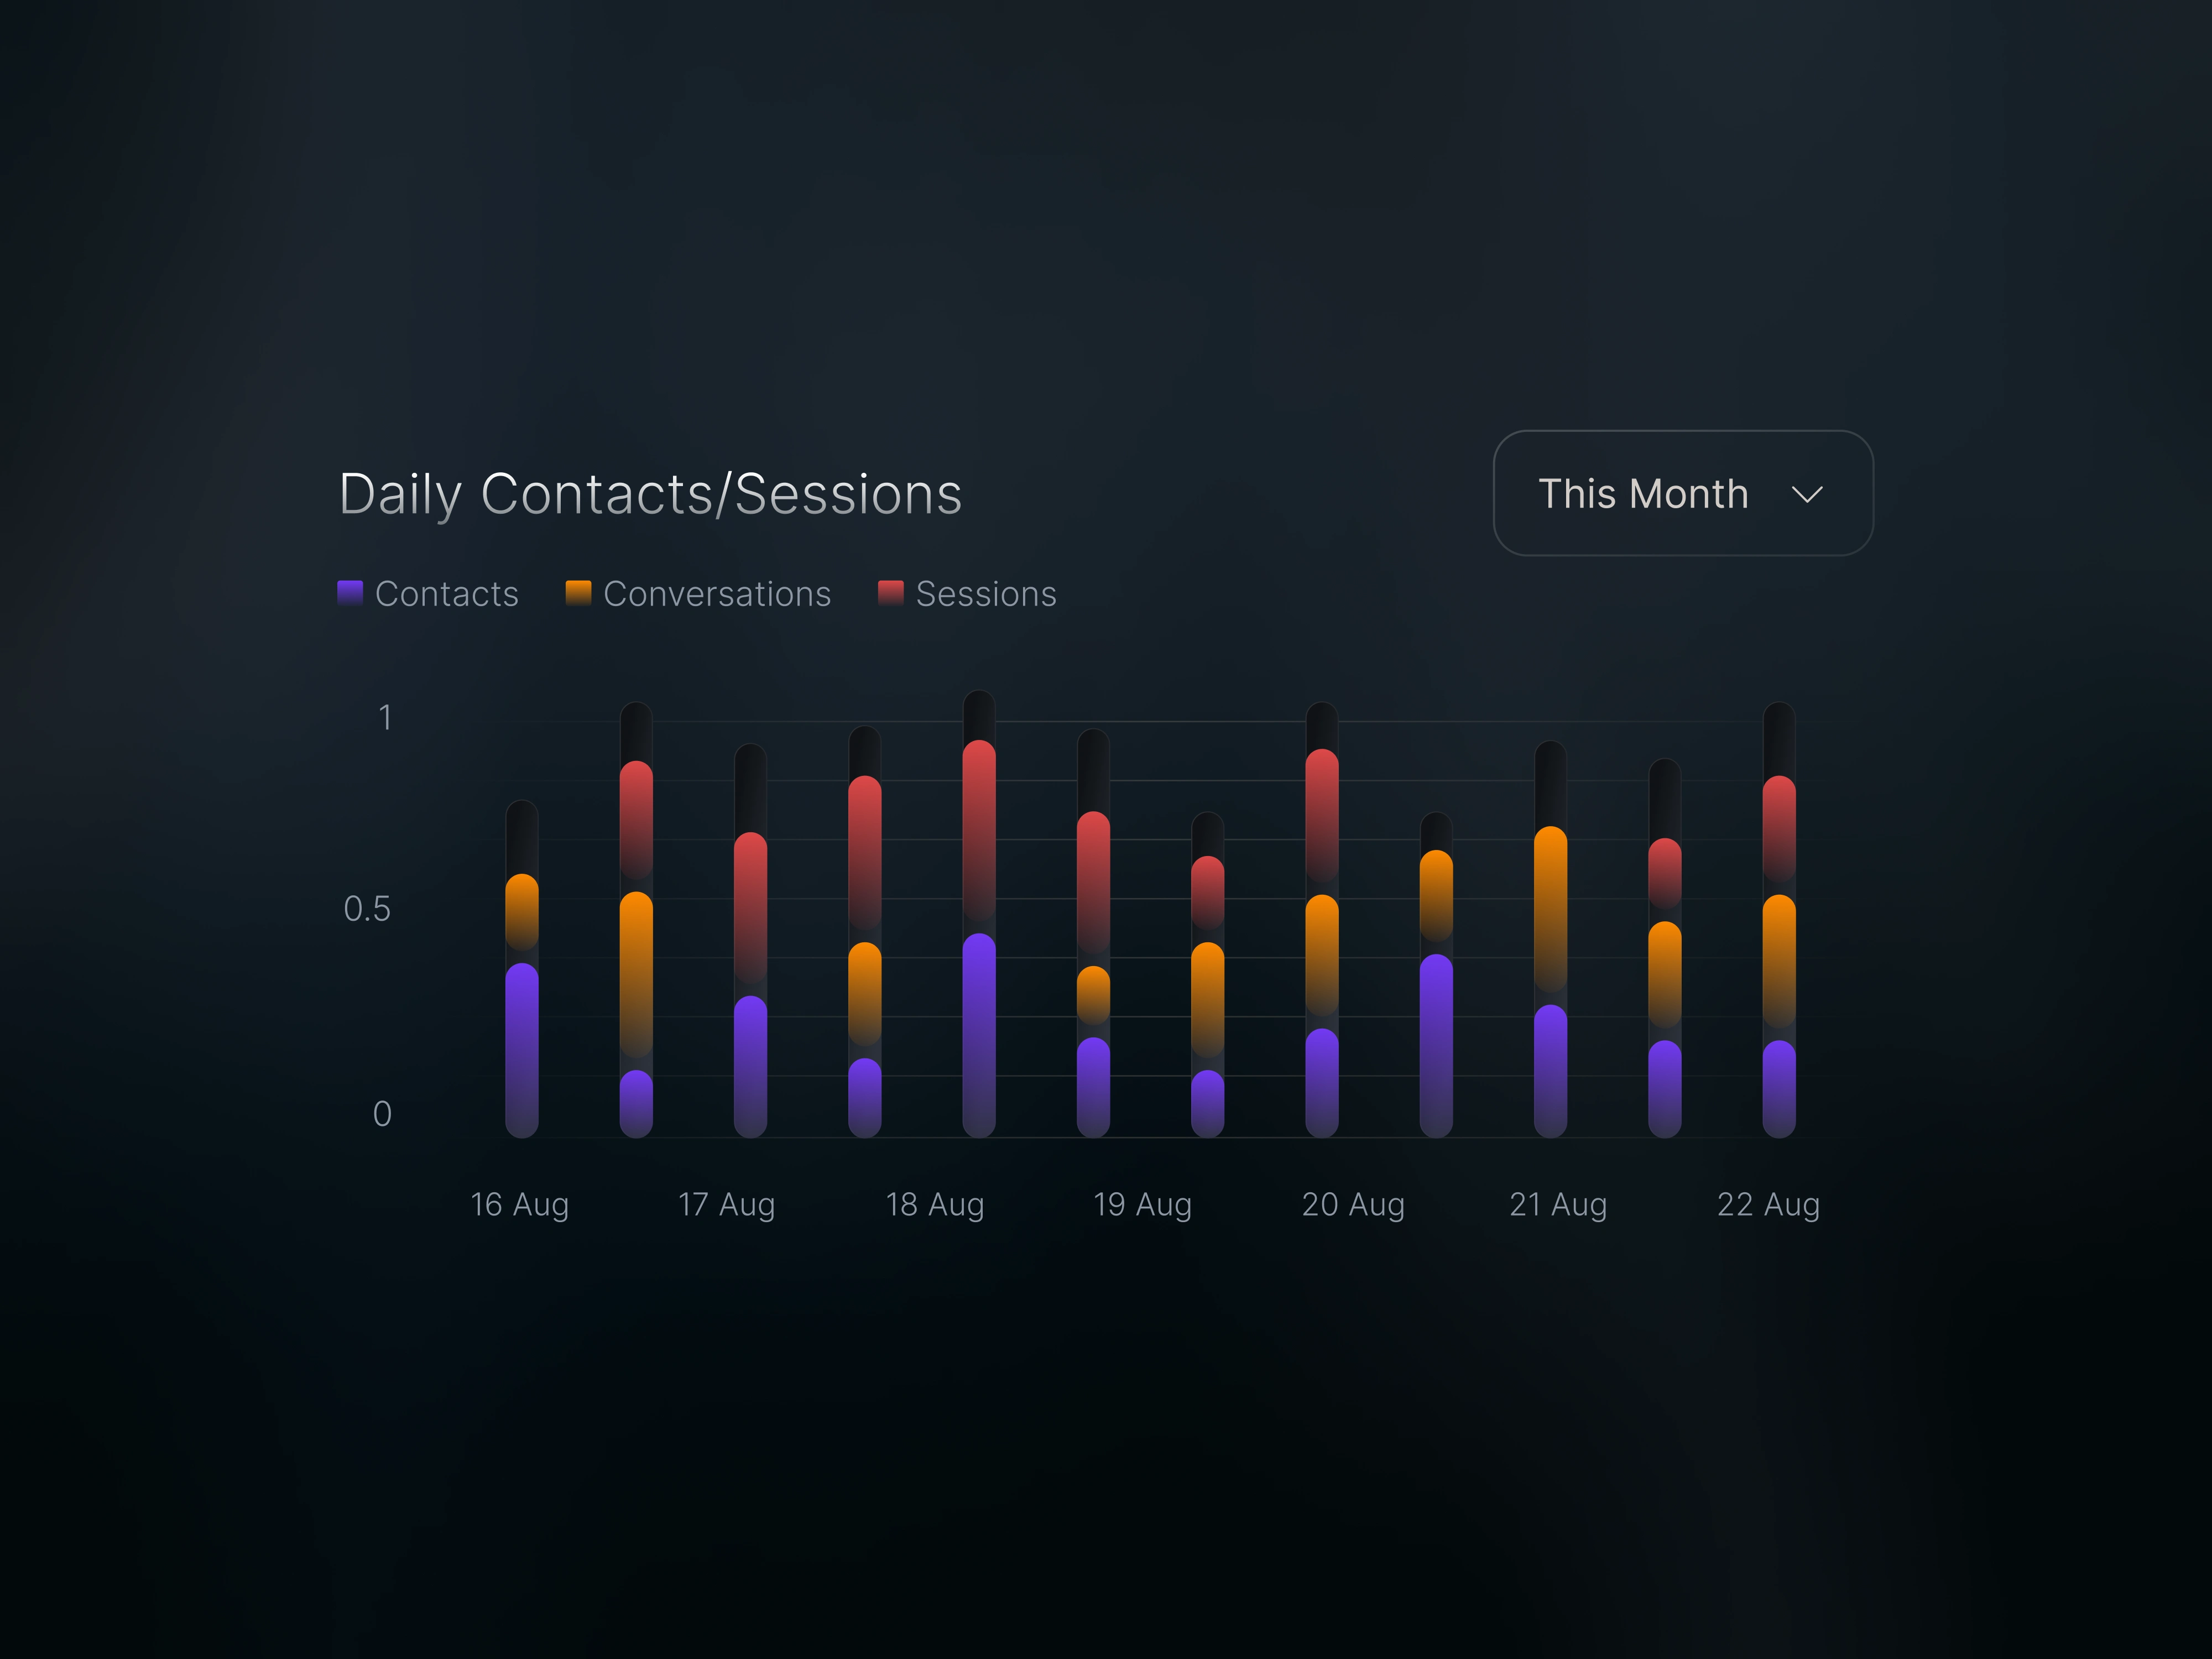
Daily Contact & Sessions Graphs
Features graphs that display daily interaction volumes and session data, helping to track user engagement.
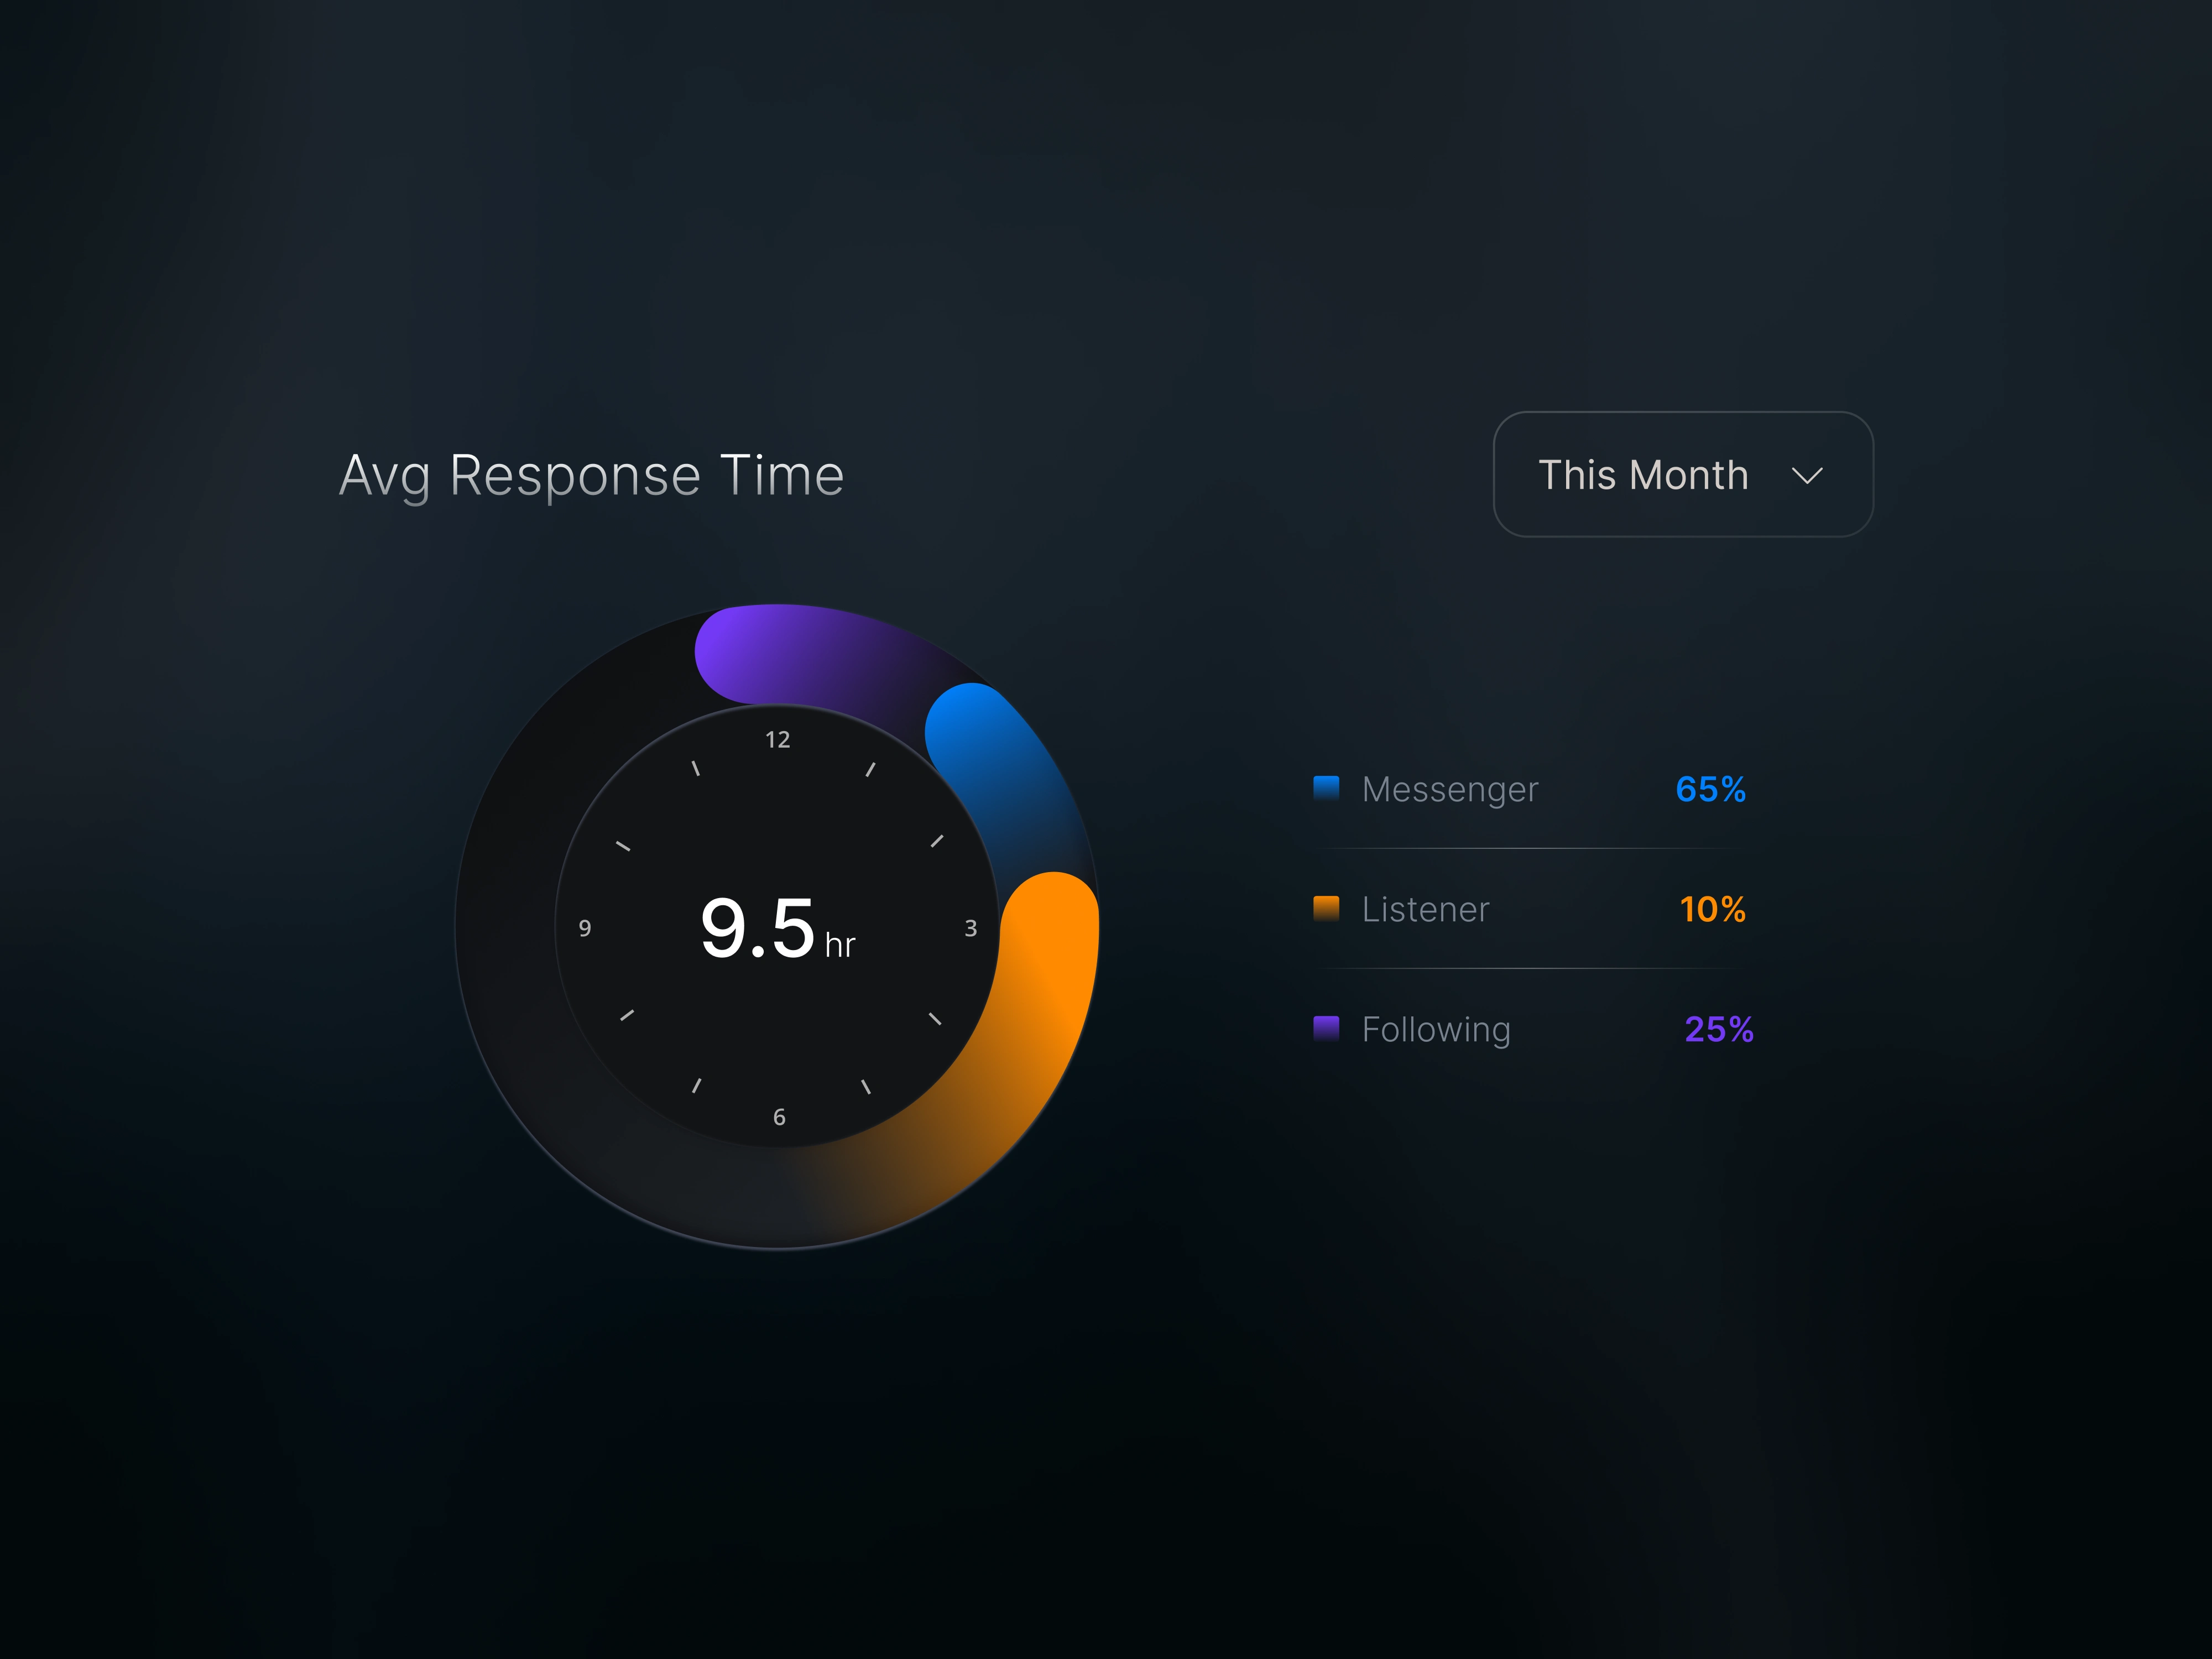
Average Response Time Graph
Provides a visual representation of response times to assess service efficiency and identify improvement areas.
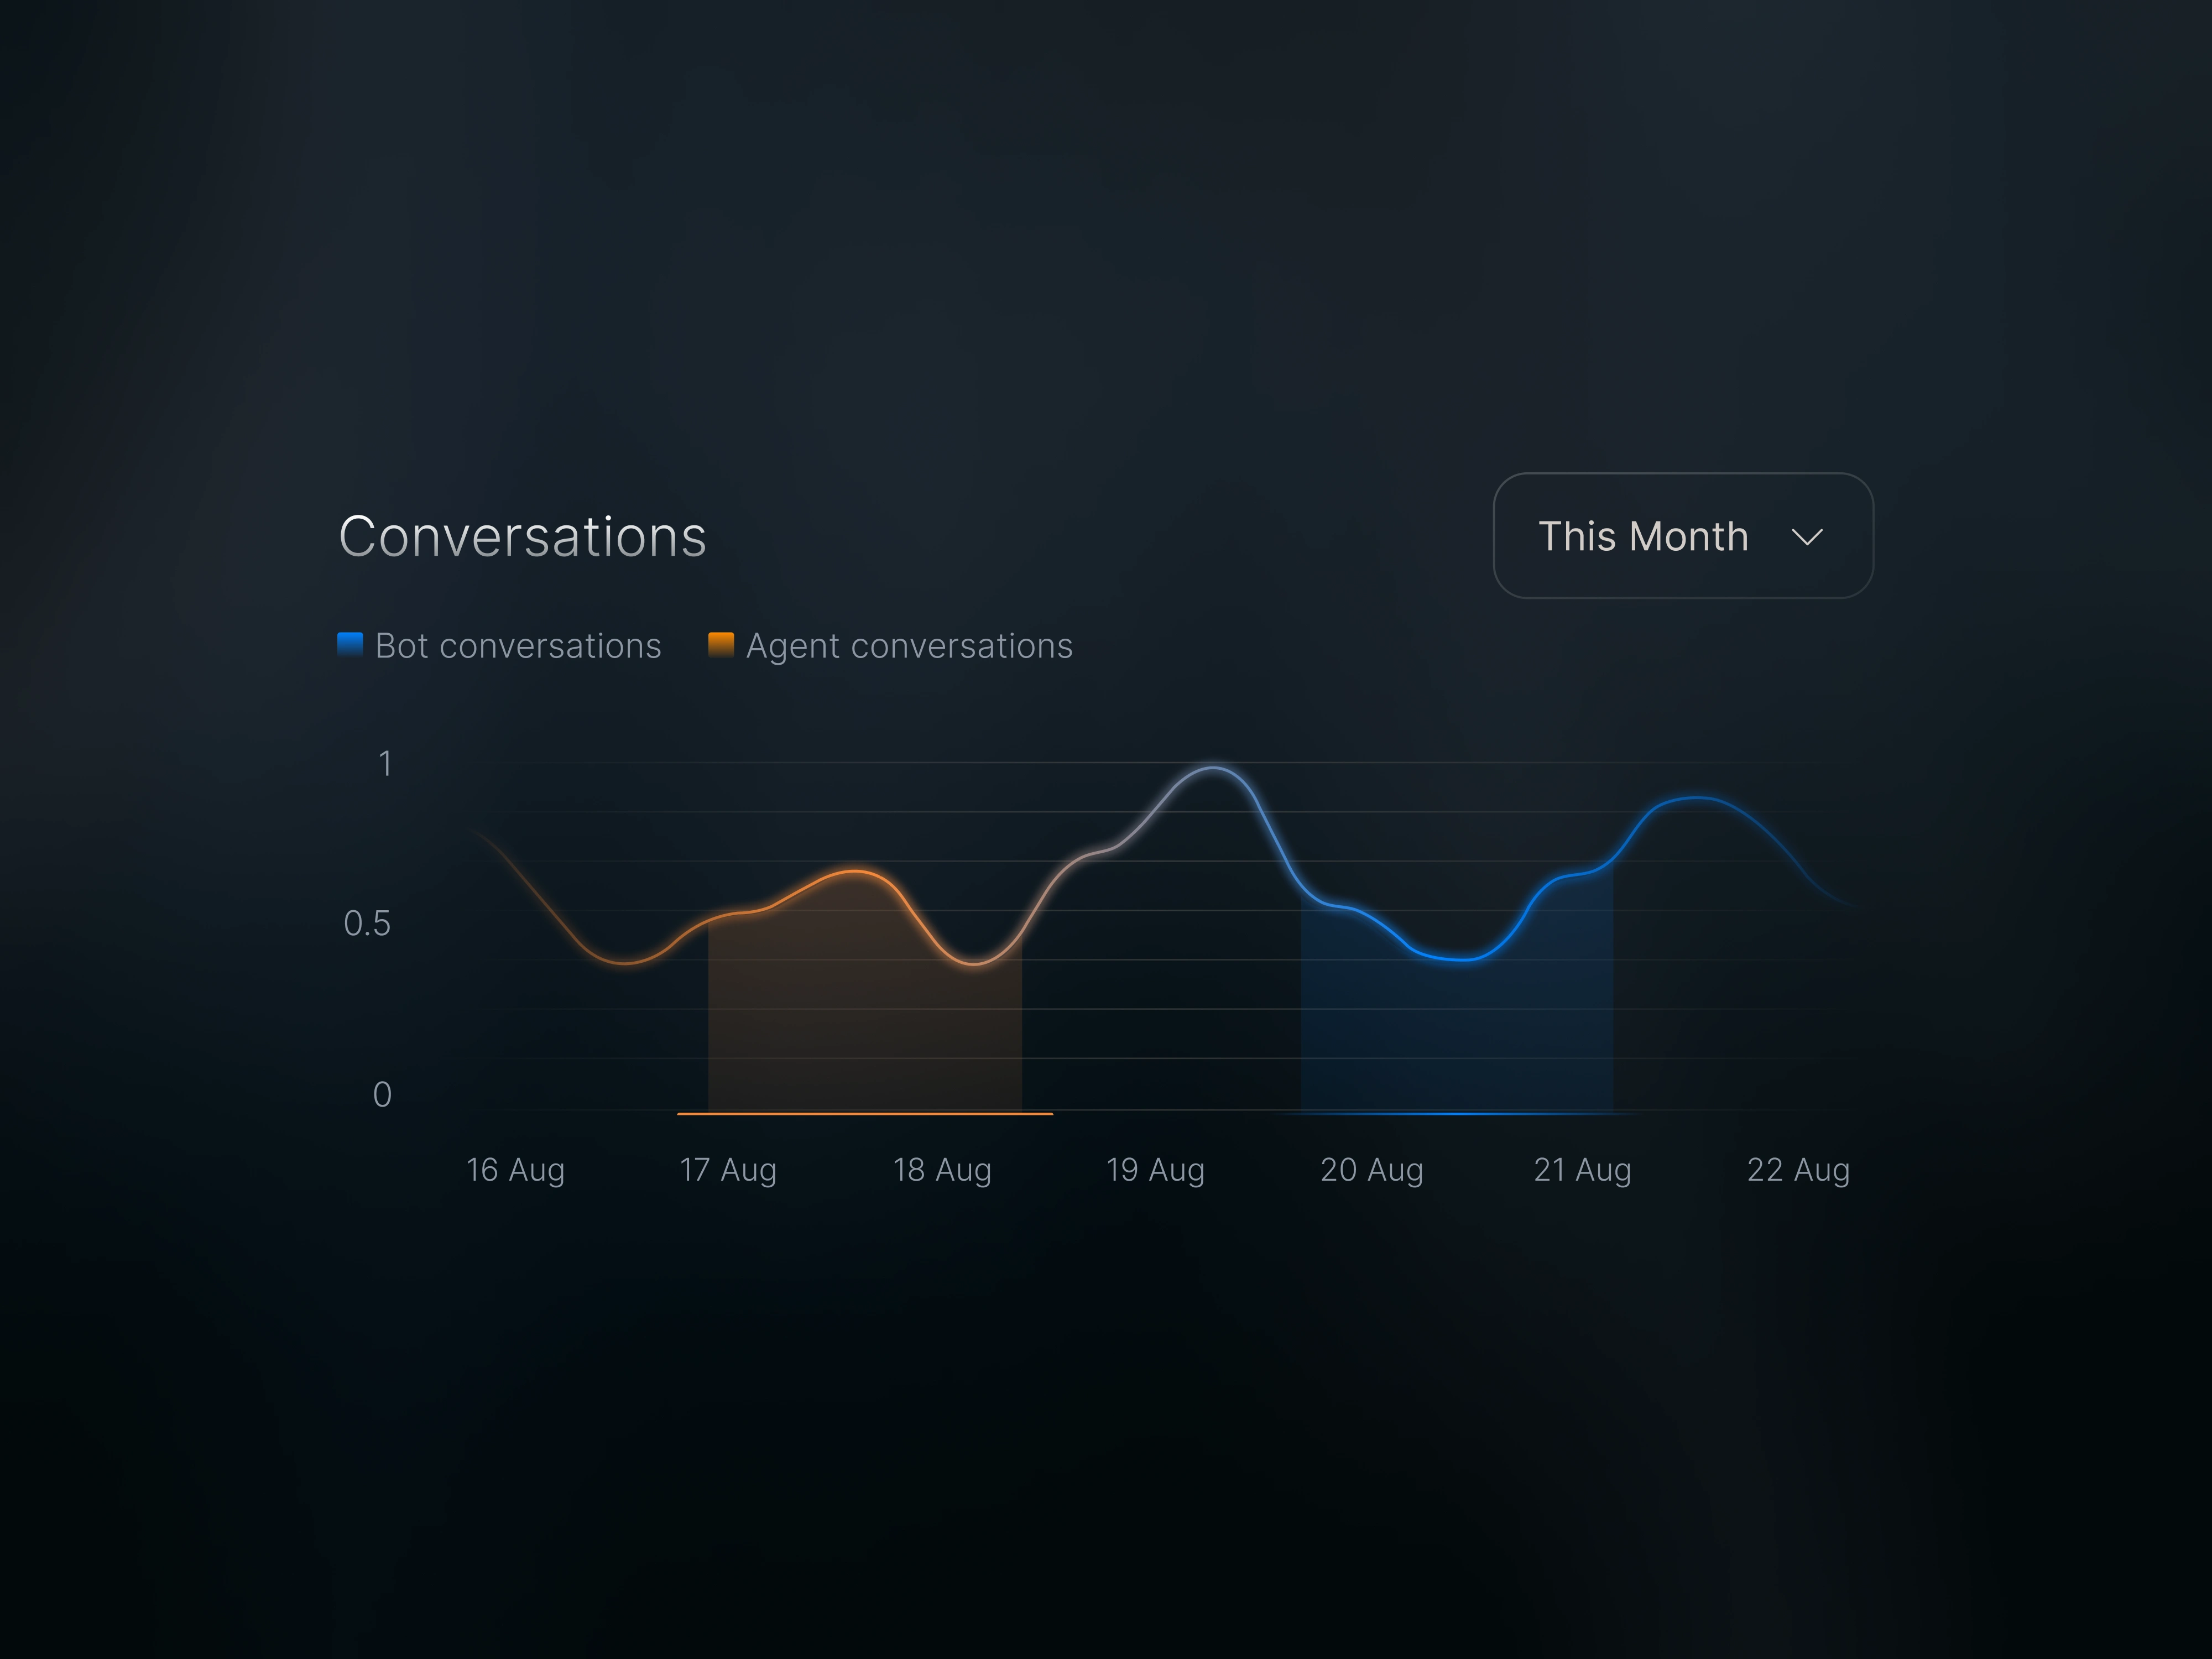
Conversations Graphs
Displays trends and patterns in user conversations, aimed at understanding interaction dynamics and user behavior.
This conceptual UI design for the AI Dashboard aims to enhance data accessibility and decision-making through clear, interactive visualizations.
Like this project
Posted Aug 2, 2024
AI Dashboard is a conceptual UI design that centralizes key metrics with intuitive widgets.
Likes
0
Views
23