Interactive Dashboard for Supermarket Sales Data Analysis
Vikranti Saxena
About:
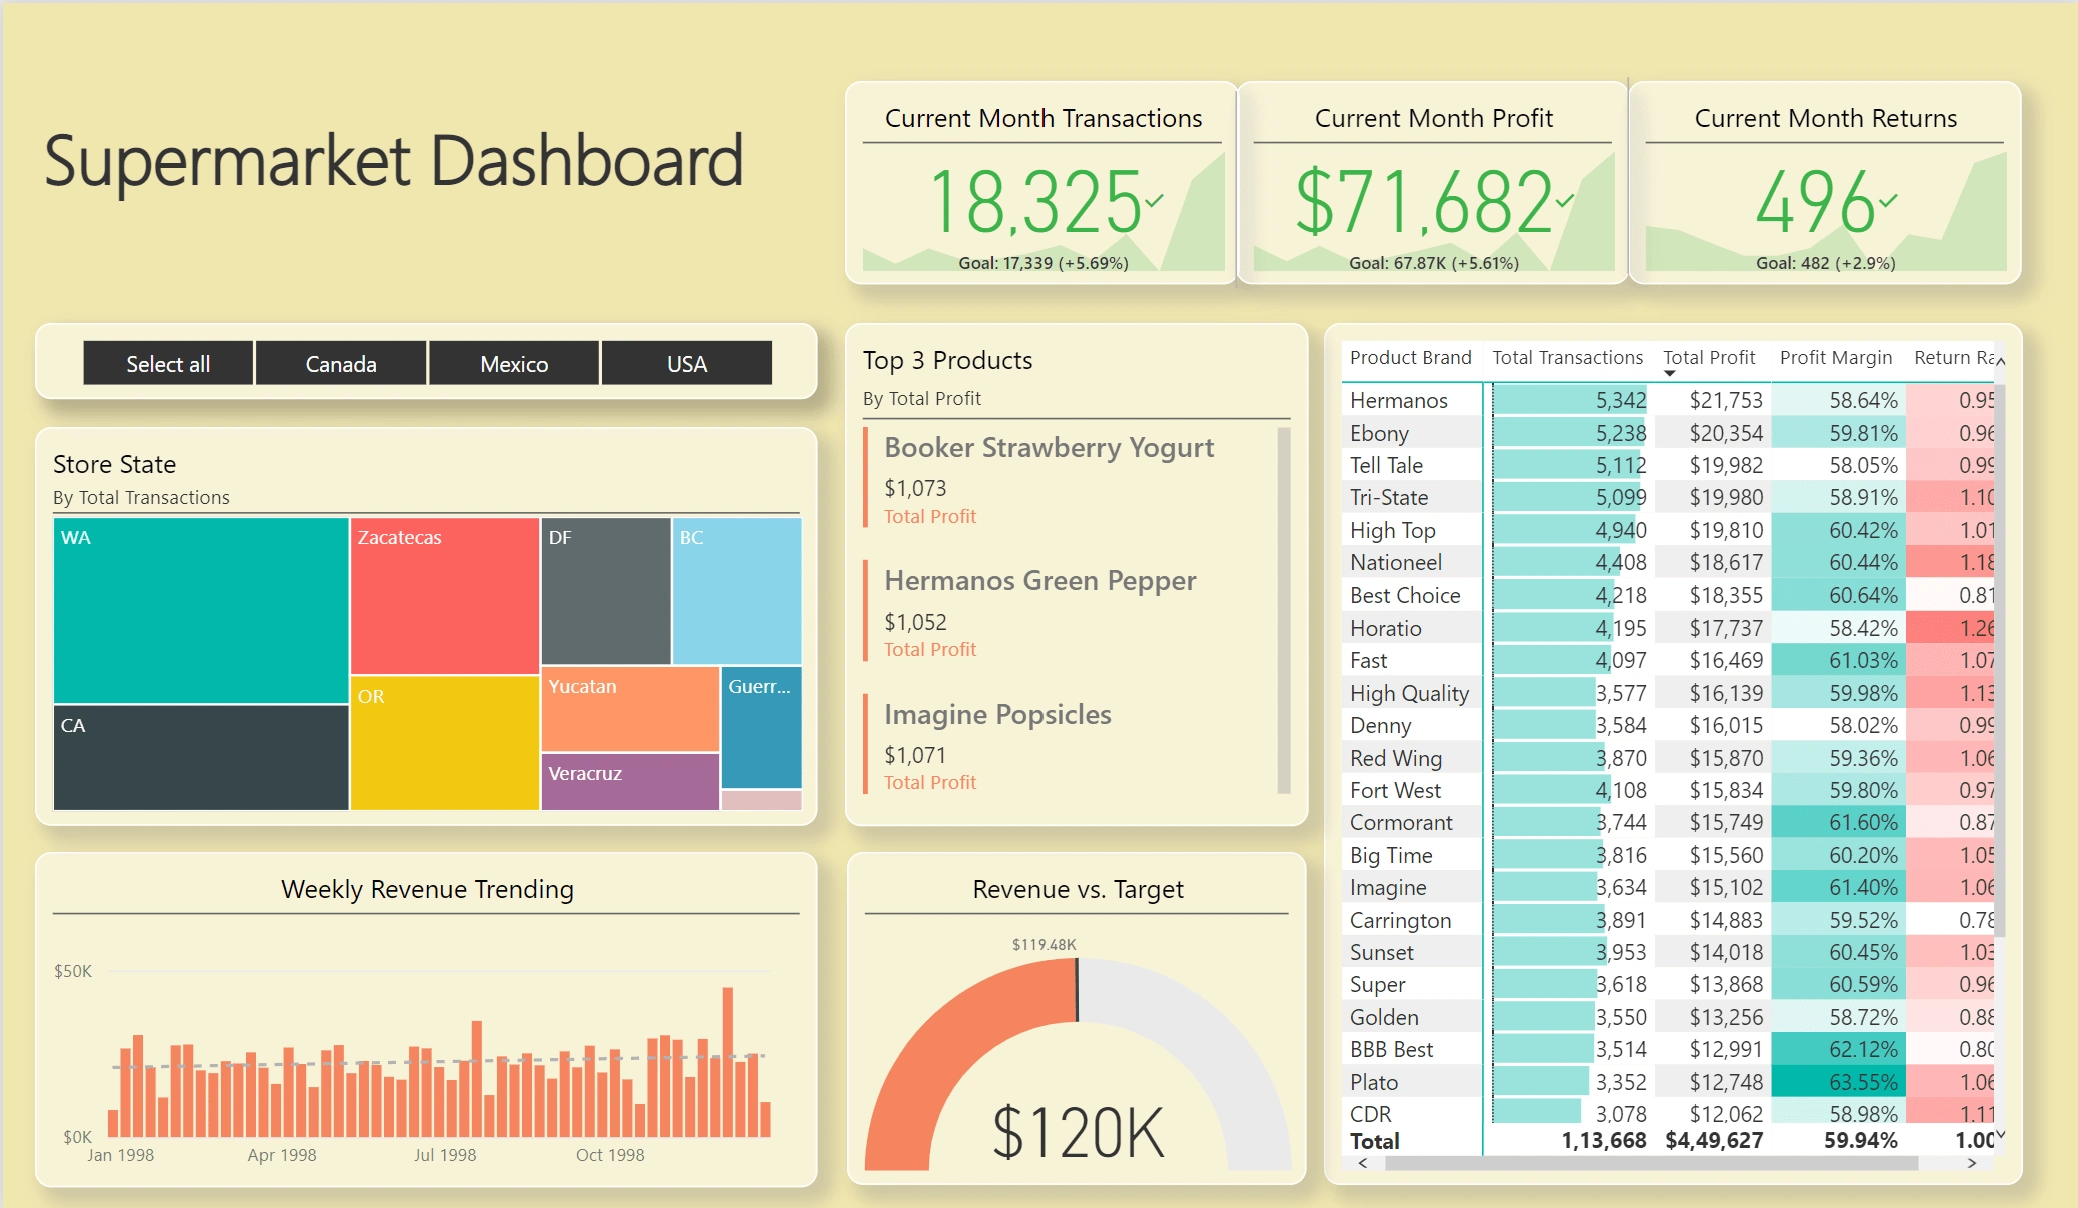
Created a PowerBI dashboard that allowed the clients to easily visualize and understand Supermarket Store sales data in real time.
Included insightful KPIs such as:
Current Month Transactions, Profit and Returns
Top 3 Products based on Total Profit
States in which stores are located based on Total Transactions
Weekly Revenue Trending
Let's transform your data into actionable insights, click here !
Like this project
Posted Apr 9, 2023
Created a PowerBI dashboard that allowed the clients to easily visualize and understand Supermarket Store sales data in real time