Redesigned PowerBI Dashboard for Product Sales Analysis
Vikranti Saxena
About:
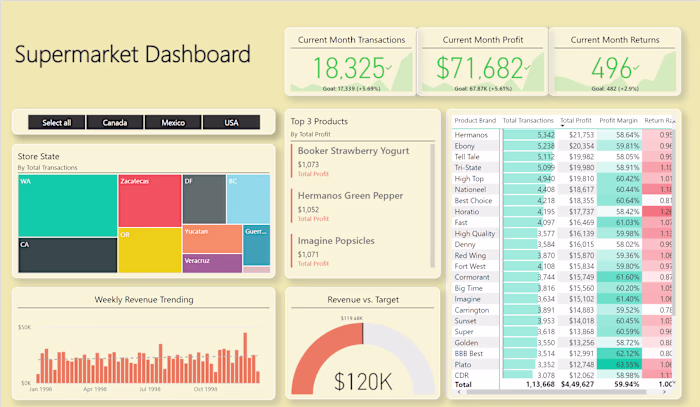
Redesigned an outdated PowerBI dashboard to provide clients with a more intuitive and visually appealing way to generate insights on Product's Sales & Returns data.
Included important metrics such as:
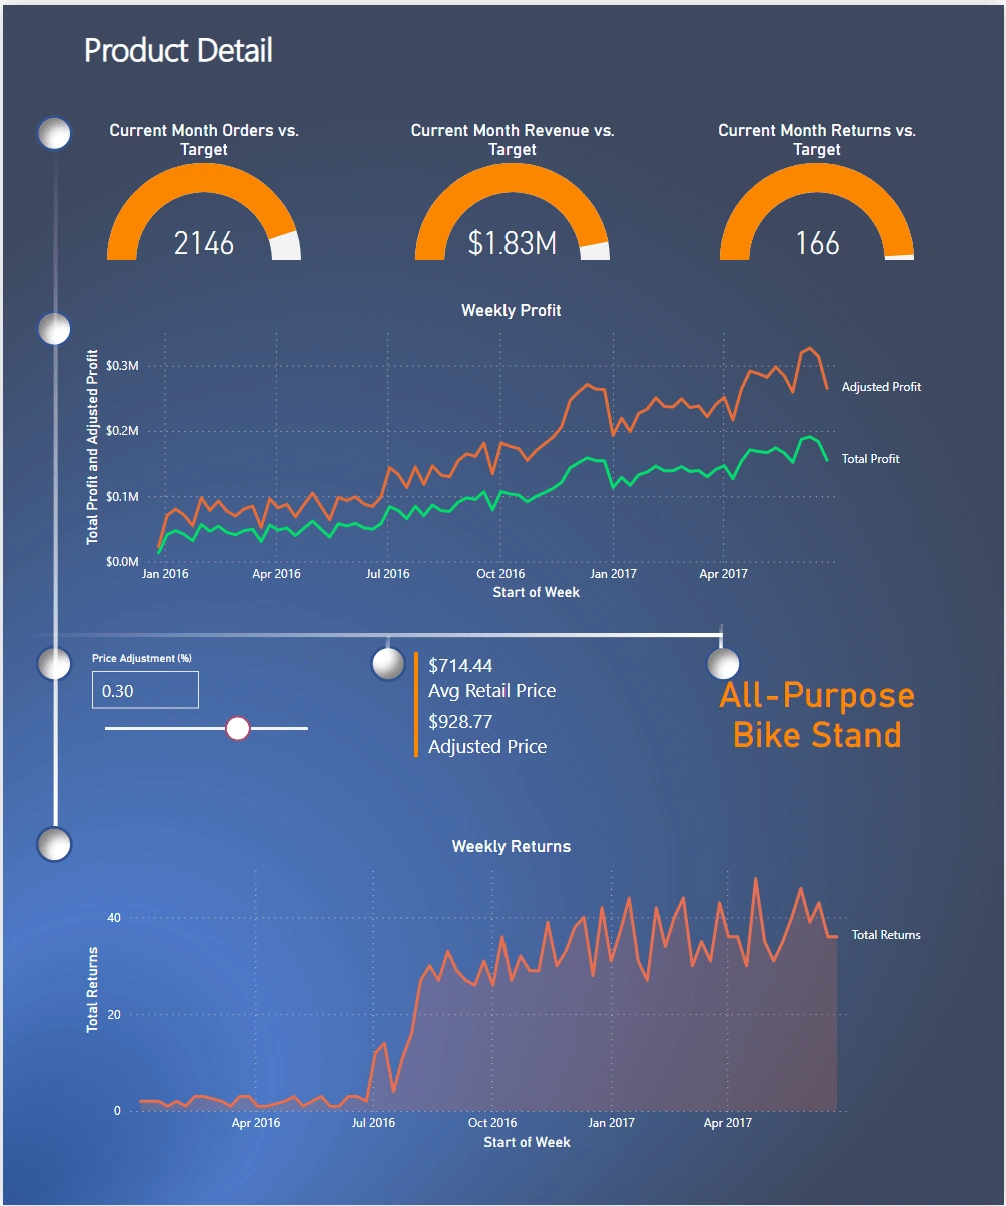
Adjusted Price Vs Average Retail Price
Total Profit Vs Adjusted Profit
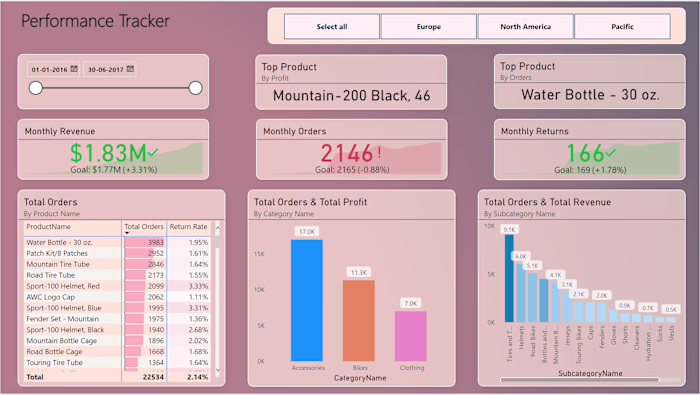
Current Month Orders Vs Target Orders
Current Month Revenue Vs Target Revenue
Current Month Returns Vs Target Returns
Let's transform your data into actionable insights, click here !
Like this project
Posted Apr 9, 2023
Redesigned a PowerBI dashboard to provide clients with a more intuitive and visually appealing way to generate insights on Product's Sales & Returns data