
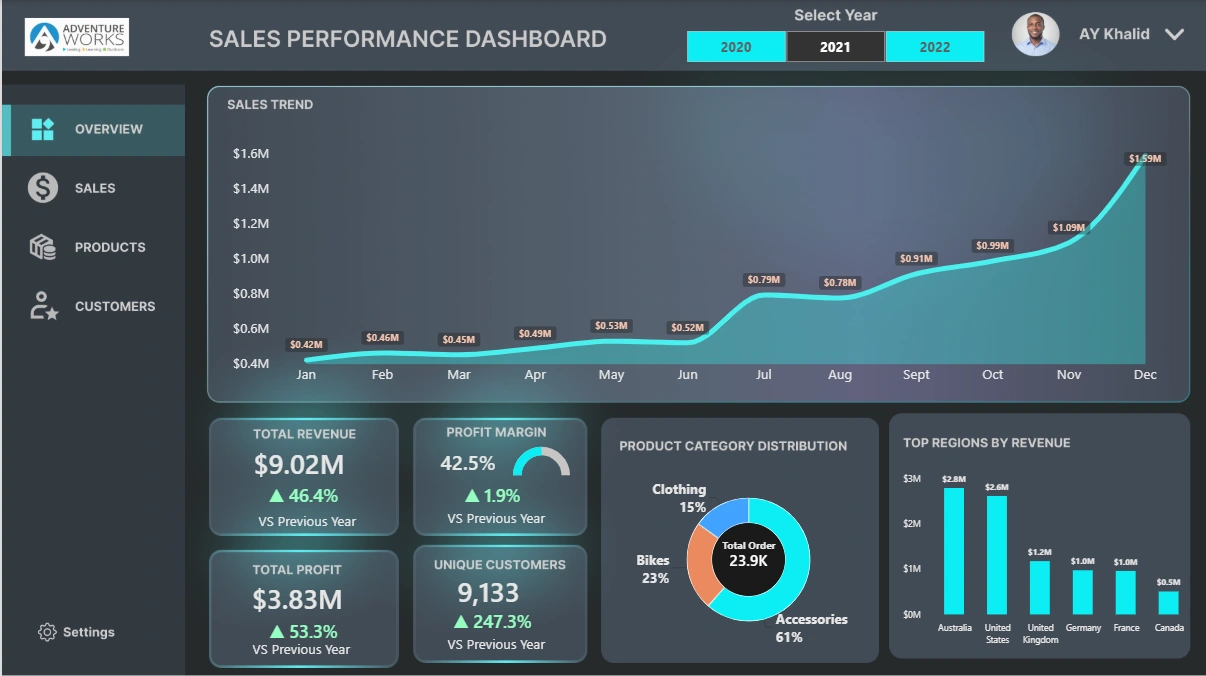
Designed an end-to-end interactive executive dashboard analyzing sales performance, revenue trajectory, and product category distribution.
Key Highlights & Value Delivered:
Executive KPI Tracking: Monitored high-level metrics including $9.02M in Total Revenue (+46.4% YoY) and a 42.5% Profit Margin.
Trend & Seasonality Analysis: Built month-over-month trajectory tracking that highlighted late-year volume surges (scaling from $0.42M in Jan to $1.59M in Dec).
Segment Breakdown: Visualized category distribution and regional revenue rankings to help decision-makers pinpoint high-performing product lines and territories.
Tech Stack: Power BI / DAX, SQL, Data Modeling, UX/UI Dashboard Design.
0 likes · 0 views · Oct 26, 2026
Designed an end-to-end interactive executive dashboard analyzing sales performance, revenue trajectory, and product category distribution. Key Highlights & V...


