
Anidu Yakubu Khalid
I am a detailed oriented data analyst from Nigeria
- 1
- Followers


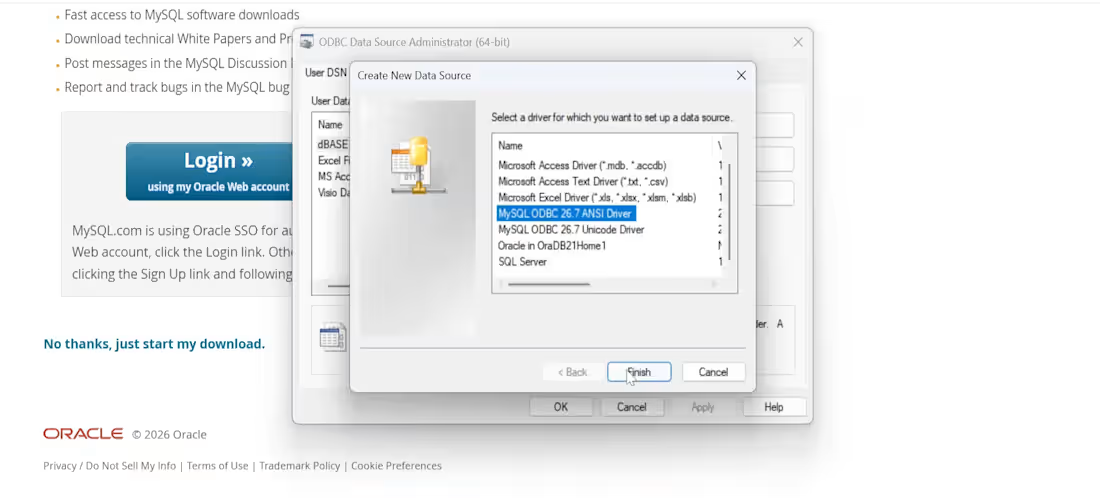
Your data lives in a database. Stop exporting data from database to Excel while you can connect Excel directly to your database.
I am open to assist your business connect Microsoft Excel to your database.
1
24
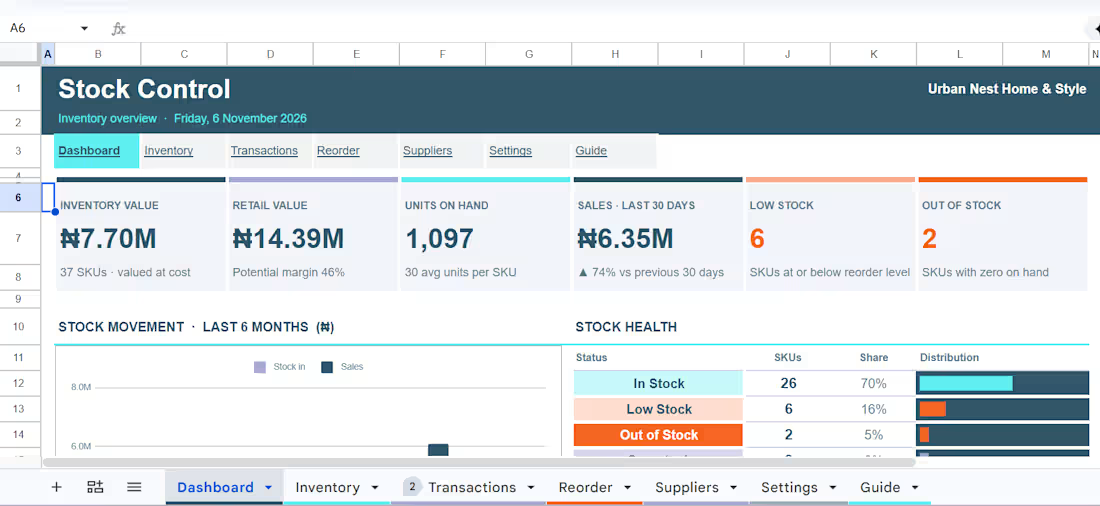
An inventory management system for a small business.
You need to take account of what is happening in your business.
I will help you build stock tracking system with Google sheets or Microsoft Excel.
I am open.
1
56
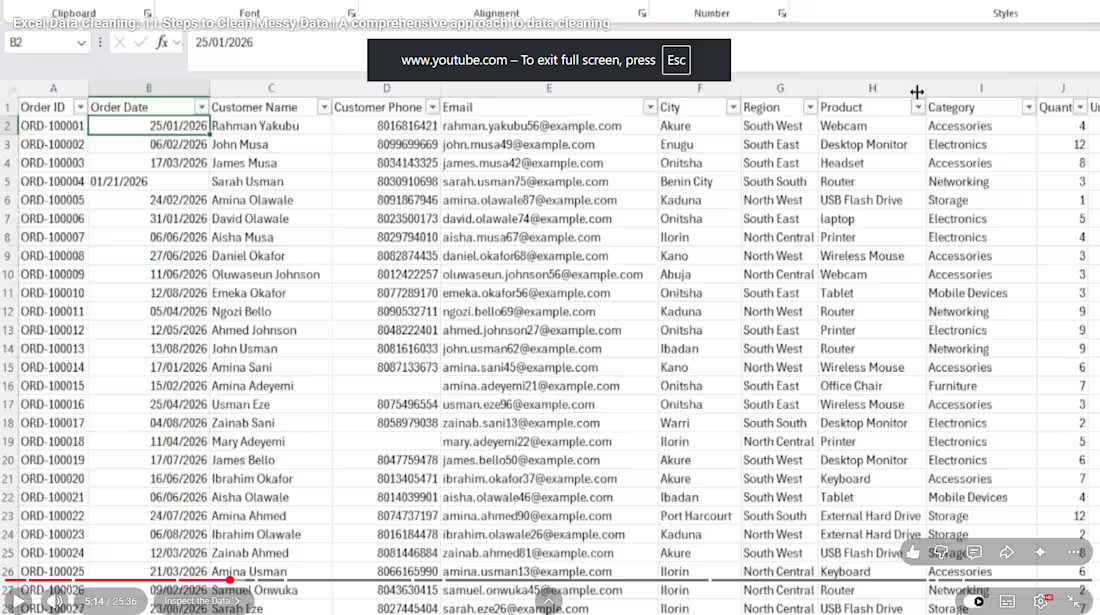
This project demonstrates a production-grade data cleaning workflow designed to transform an unstandardized, error-prone sales dataset (~2,000 transaction records) into an analysis-ready asset. The focus is on preserving raw data lineage, enforcing data privacy regulations, repairing mathematical and structural inconsistencies, and implementing reproducible cleaning techniques using native Excel functionality.
Key Technical Deliverables & Methodology
Data Lineage & File Integrity: Established non-destructive audit trails by archiving raw data externally and internally, then migrated source .csv data into structured .xlsx workbooks to preserve calculation metadata and multi-tab workflows.
Data Privacy Compliance (PII Scrubbing): Audited and stripped Personally Identifiable Information (customer names, phone contacts, email addresses) to align the analytical environment with data privacy standards before reporting.
Text Normalization & Deduplication: Cleansed categorical attributes (cities, regions, product lines) using nested TRIM() and PROPER() functions, removed formula dependencies via static value conversion, and systematically eliminated duplicate records to prevent skewed transactional totals.
Arithmetic Reconciliation & Error Recovery: Identified faulty quantities, missing discounts, and #N/A unit prices. Used algebraic reverse-engineering:
$$\text{Unit Price} = \frac{\text{Subtotal}}{\text{Quantity} \times (1 - \text{Discount})}$$
to restore true transaction economics before recalculating VAT (7.5%) and gross invoice amounts.
Custom Dynamic Date Parsing: Resolved mixed-standard date entries (US MM/DD/YYYY vs. UK DD/MM/YYYY) where default type conversion failed, engineering a dynamic extraction formula utilizing IF(), ISNUMBER(), DATE(), RIGHT(), LEFT(), and MID().
Missing Value Imputation (The 3Rs Framework): Evaluated incomplete attributes under the Remove, Replace, or Retain paradigm, imputing unrecorded categorical dimensions (Sales Rep, Suppliers) with standardized "Unknown" categories to prevent attrition bias during aggregation.
1
38
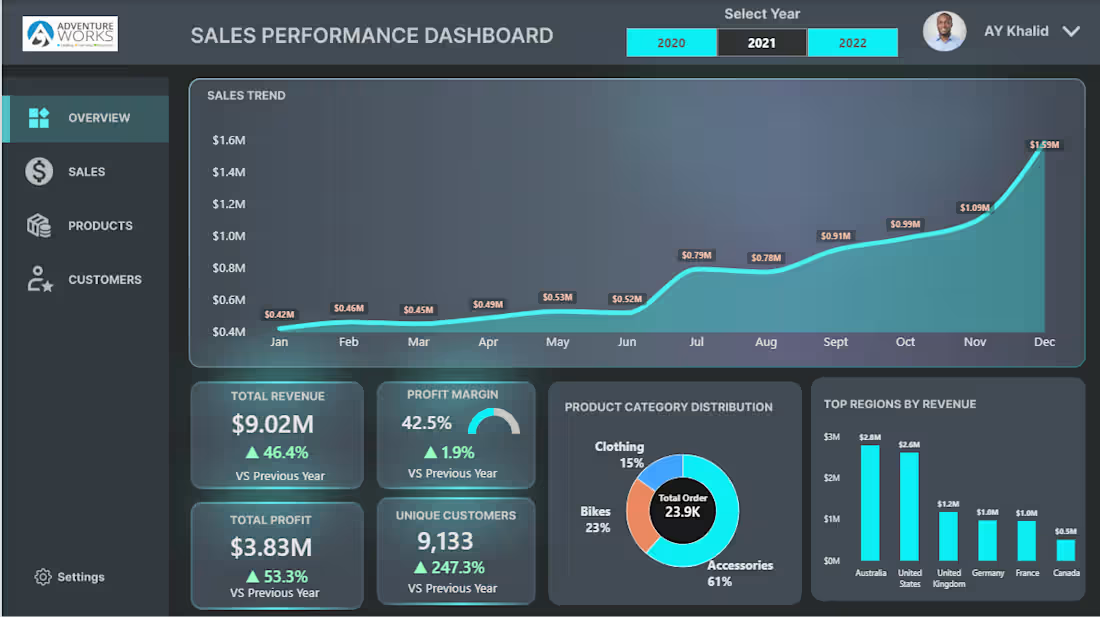
Designed an end-to-end interactive executive dashboard analyzing sales performance, revenue trajectory, and product category distribution.
Key Highlights & Value Delivered:
Executive KPI Tracking: Monitored high-level metrics including $9.02M in Total Revenue (+46.4% YoY) and a 42.5% Profit Margin.
Trend & Seasonality Analysis: Built month-over-month trajectory tracking that highlighted late-year volume surges (scaling from $0.42M in Jan to $1.59M in Dec).
Segment Breakdown: Visualized category distribution and regional revenue rankings to help decision-makers pinpoint high-performing product lines and territories.
Tech Stack: Power BI / DAX, SQL, Data Modeling, UX/UI Dashboard Design.
1
33