Automated OpenNebula Monitoring and Alerting

Mohammed Abul Azad Faisal


Automated OpenNebula Monitoring and Alerting Architecture
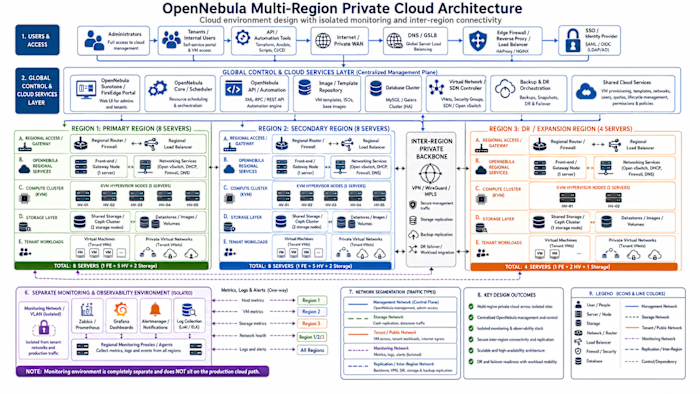
Designed an automated monitoring and observability architecture for a multi-region OpenNebula private cloud environment.
The solution automatically discovers newly created virtual machines through the OpenNebula API and registers them in Zabbix without requiring manual monitoring configuration. Once a VM is detected, it is assigned to the appropriate host group based on its region, environment, operating system, or customer.
Monitoring templates are then applied automatically for Linux, Windows, hypervisor, network, and storage systems. This ensures that every newly provisioned VM receives consistent monitoring, trigger thresholds, availability checks, and alerting policies from the moment it becomes active.
The architecture includes regional Zabbix proxies that collect monitoring data from each OpenNebula region and securely forward it to a centralized Zabbix Server. This reduces cross-region monitoring traffic and allows monitoring to continue locally during temporary network interruptions.
The platform monitors:
CPU and memory utilization
Disk capacity and performance
Network traffic and packet loss
Operating system availability
Services and running processes
VM uptime and availability
Hypervisor health
Storage availability and performance
Network devices using SNMP
Web services and APIs using HTTP checks
When a problem is detected, Zabbix evaluates the configured trigger and escalation policy. Notifications are then automatically routed to Telegram, Microsoft Teams, and email based on severity, environment, and operational responsibility.
Grafana is integrated with Zabbix as a centralized visualization platform. It provides real-time dashboards for infrastructure health, regional availability, VM performance, uptime, service-level objectives, resource capacity, and active alerts.
The monitoring environment is isolated from tenant and production networks using a dedicated monitoring network. Only controlled monitoring, API, and notification traffic is permitted between the cloud regions and the monitoring platform.
Key outcomes of the solution include:
Automatic VM discovery and monitoring enrollment
Consistent monitoring across all OpenNebula regions
Automated template and policy assignment
Centralized alerting and escalation
Telegram, Microsoft Teams, and email notifications
Real-time Grafana dashboards
Reduced manual administration
Faster incident detection and response
Scalable monitoring for future cloud expansion
This project demonstrates my ability to integrate OpenNebula, Zabbix, Grafana, API-driven automation, multi-region monitoring, centralized alerting, and secure network segmentation into a complete private cloud observability platform.
Like this project
Posted Aug 6, 2026
Automated OpenNebula Monitoring and Alerting Architecture Designed an automated monitoring and observability architecture for a multi-region OpenNebula priva...
Likes
0
Views
3
Timeline
Jul 1, 2026 - Jul 30, 2026