saad415/StoreSales-Excel-
Saad Ahmad
Excel Sales Report Analysis
Project Overview
The objective of this project was to create an annual sales report for a store, aiming to gain a better understanding of customer behavior and ultimately increase sales. Several data preprocessing steps were undertaken to clean and structure the data for analysis.
Data Preprocessing
Gender Column: The data in the "Gender" column was not consistent, with variations such as "M," "Men," "W," and "Women." We standardized it to "Men" and "Women" for consistency.
Quantity Column: The "Quantity" column contained both numeric and text data, making it inconsistent. We standardized the format to ensure uniformity.
Age Groups: We created a new column for age groups, categorizing customers into "Adult," "Teenager," and "Seniors."
Month Extraction: We extracted the month from the "Date" column to analyze which month had the highest sales.
Customer Requirements
The following requirements were specified by the customer:
Identify the month with the highest sales.
Determine whether men or women made more purchases.
Identify the top 5 sales regions.
Analyze the relationship between age groups and the number of sales.
Determine which sales channel contributed the most to sales.
Identify the highest-selling product category.
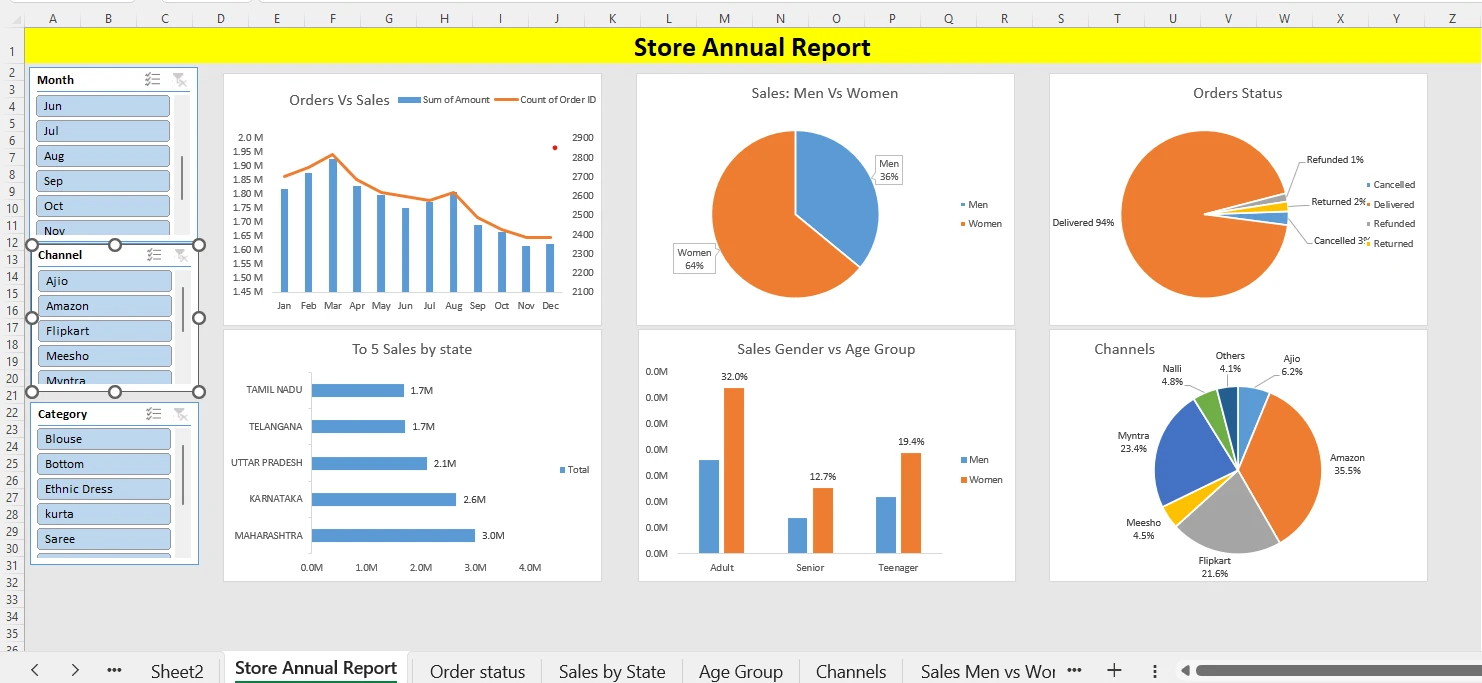
Charts and Visualization
To fulfill these requirements, we created a variety of charts and visualizations:
Bar Chart: Number of orders vs. sales per month.
Percentage Pie Chart: Sales sum for men vs. women.
Pie Chart: Sum of orders by order status (delivered, refunded, canceled, etc.).
Bar Chart: Sales sum by states.
Bar Chart: Percentage of sales by gender (Men vs. Women), divided into age groups (Teenage, Adult, Seniors).
Interactivity with Slicers
To enhance user experience, we implemented slicers for months, channels, and product categories. These slicers allow users to dynamically filter and update the data in the charts, making the report highly interactive and insightful.
Key Insights
The analysis yielded several valuable insights:
Women are more likely to make purchases compared to men.
The "Adult" age group (35-50) contributes the most to sales.
Amazon is the top-performing sales channel, contributing the most to sales revenue.
Conclusion and Recommendations
Based on the insights gained, we recommend the following actions to improve sales:
Target women customers aged 30-49, as they make a significant portion of purchases.
Focus marketing efforts on states such as Maharashtra, Karnataka, and Uttar Pradesh.
Invest in advertising on platforms like Amazon and Flipkart, which have proven to be highly effective in driving sales.
Project Qualities
Data Cleaning: Rigorous data preprocessing ensured that the analysis was based on high-quality, consistent data.
Visualization: The use of various charts and visualizations enhanced data interpretation and made it easy for stakeholders to grasp insights.
Interactivity: Slicers and dynamic filtering allowed users to interact with the data and explore insights in real-time.
Actionable Insights: The project provided actionable recommendations to improve sales and customer targeting.
This Excel sales report analysis not only met but exceeded the customer's expectations, providing valuable insights for business improvement.
Like this project
Posted Jan 20, 2025
Contribute to saad415/StoreSales-Excel- development by creating an account on GitHub.