Interactive Excel Dashboard

Joy Johnson

Project Overview
An analysis of sales transaction, customer demographics information and revenues generated in order to track important metrics as well as monitor customer purchasing behavior and sales trend over time.
Method of Analysis
Data cleaning and wrangling (removing duplicates, ensuring consistency in format and eliminating errors to maintain accuracy of data)
Data transformation and analysis to identify trends and patterns in data
Developing dashboard to visualize data and present results of findings through the use of dynamic charts and graphs
Generating reports to provide more insights into the relevance of the analysis in meeting the business needs
Summary of Findings
Majority of the customers were between the age range of 27-46, in other words they were mostly young adults
Customer purchase preferences showed that bikes were in high demand, with mountain bikes generating the highest revenue for products
Customer demographics showed that 52% were males while 48% were females, which means that there wasn't much disparity between both gender preferences
The United States had the highest customers and yielded the most income in revenue
Like this project
Posted Aug 13, 2024
I created an interactive dashboard with dynamic and easy to navigate visuals in Excel, in order to highlight important metrics for monitoring sales performance
Likes
0
Views
2


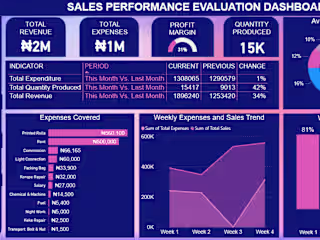
Sales Performance Analysis
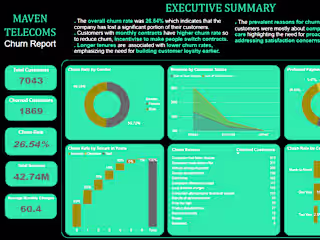
Customer Churn Analysis
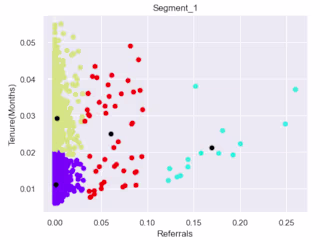
Customer Segmentation Using Python