Crenshaw University Dashboard
Chester King
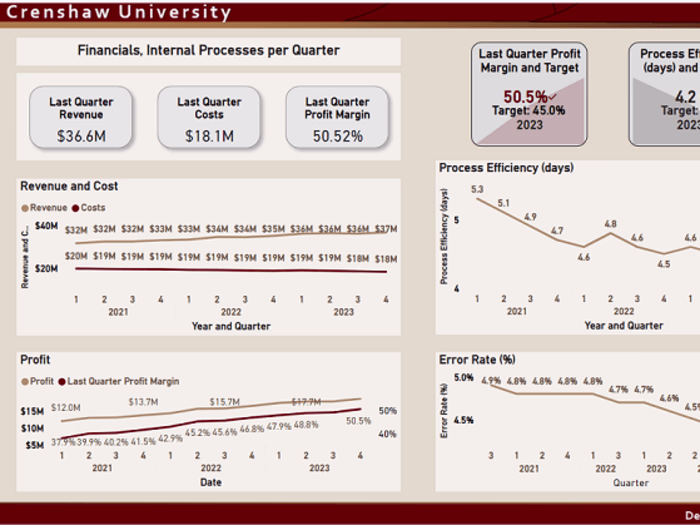
Based on data I created to show various approaches to cards, KPIs, and basic reporting for a university case study I use in my course. The report has two pages; you can navigate them from the bottom. The data goes by quarters, from 2020 to 2023, and the quarters you select determine the data you see via some DAX formulas.
Like this project
Posted Apr 1, 2024
Based on data I created, shows various approaches to cards, KPIs, and basic reporting for a university case study I use in my course. The report has two pages.