Developing Northstar Dashboards For 300+ Employees at M1
Ben Olsen
Executive Reporting Dashboards for M1

Background: M1 is a rapidly growing fintech company that manages over $6 billion dollars in assets. The company offers a wide range of products including investing, checking accounts, credit cards, and lending, to served hundreds of thousands of users.
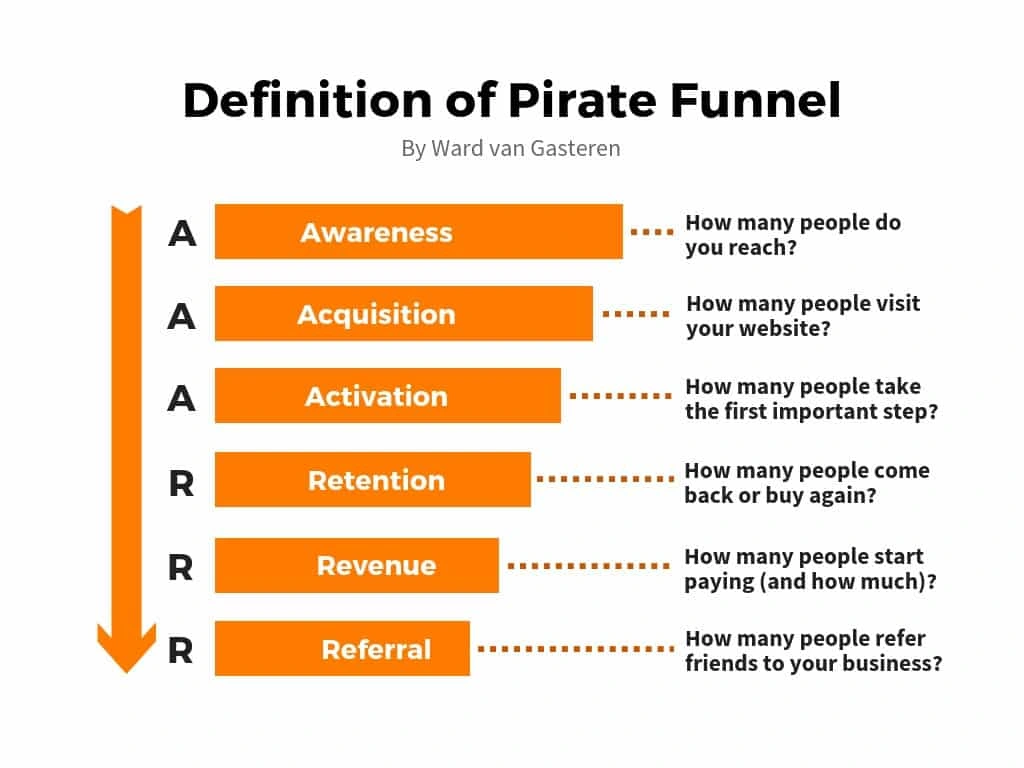
Objective: The project objective was to build executive-level reporting dashboards for M1 using the Pirate Framework. The Pirate Framework is a set of five user-behavior metrics that product-led growth businesses should be tracking: acquisition, activation, retention, referral, and revenue.
Scope: The project scope included modeling all of the data using DBT to ensure data quality and ease of use, and visualizing the data in Tableau. The dashboards provided a comprehensive view of the company's performance in terms of user behavior and revenue generation.
Deliverables: The project delivered a set of interactive dashboards that were accessible to M1's executive team. These dashboards provided insights on key metrics such as user acquisition, activation, retention, referral and revenue.
Like this project
Posted Jan 26, 2023
Implementing data modeling and interactive dashboards that were utilized by executive leadership and over 300 employees at a rapidly growing fintech startup.