Website Monitoring: Uptime, SSL & DNS Alerts

Mojtaba Karimiabdar


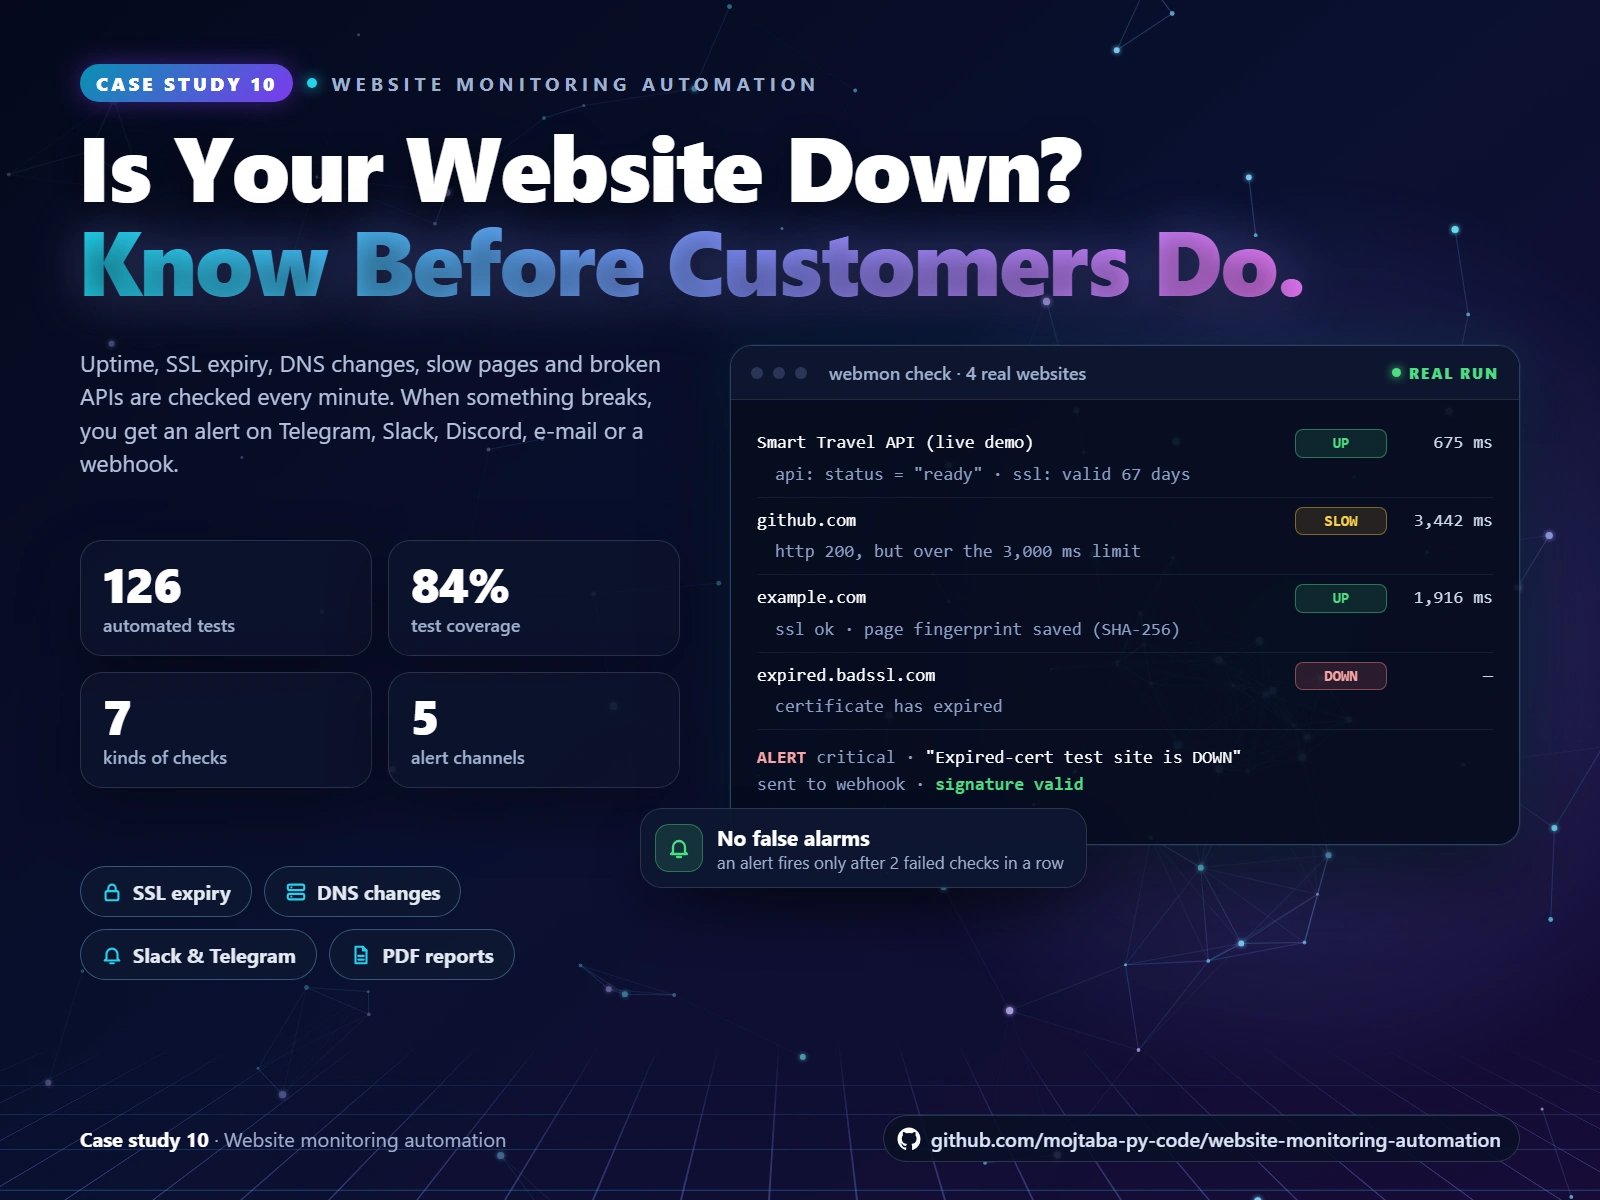
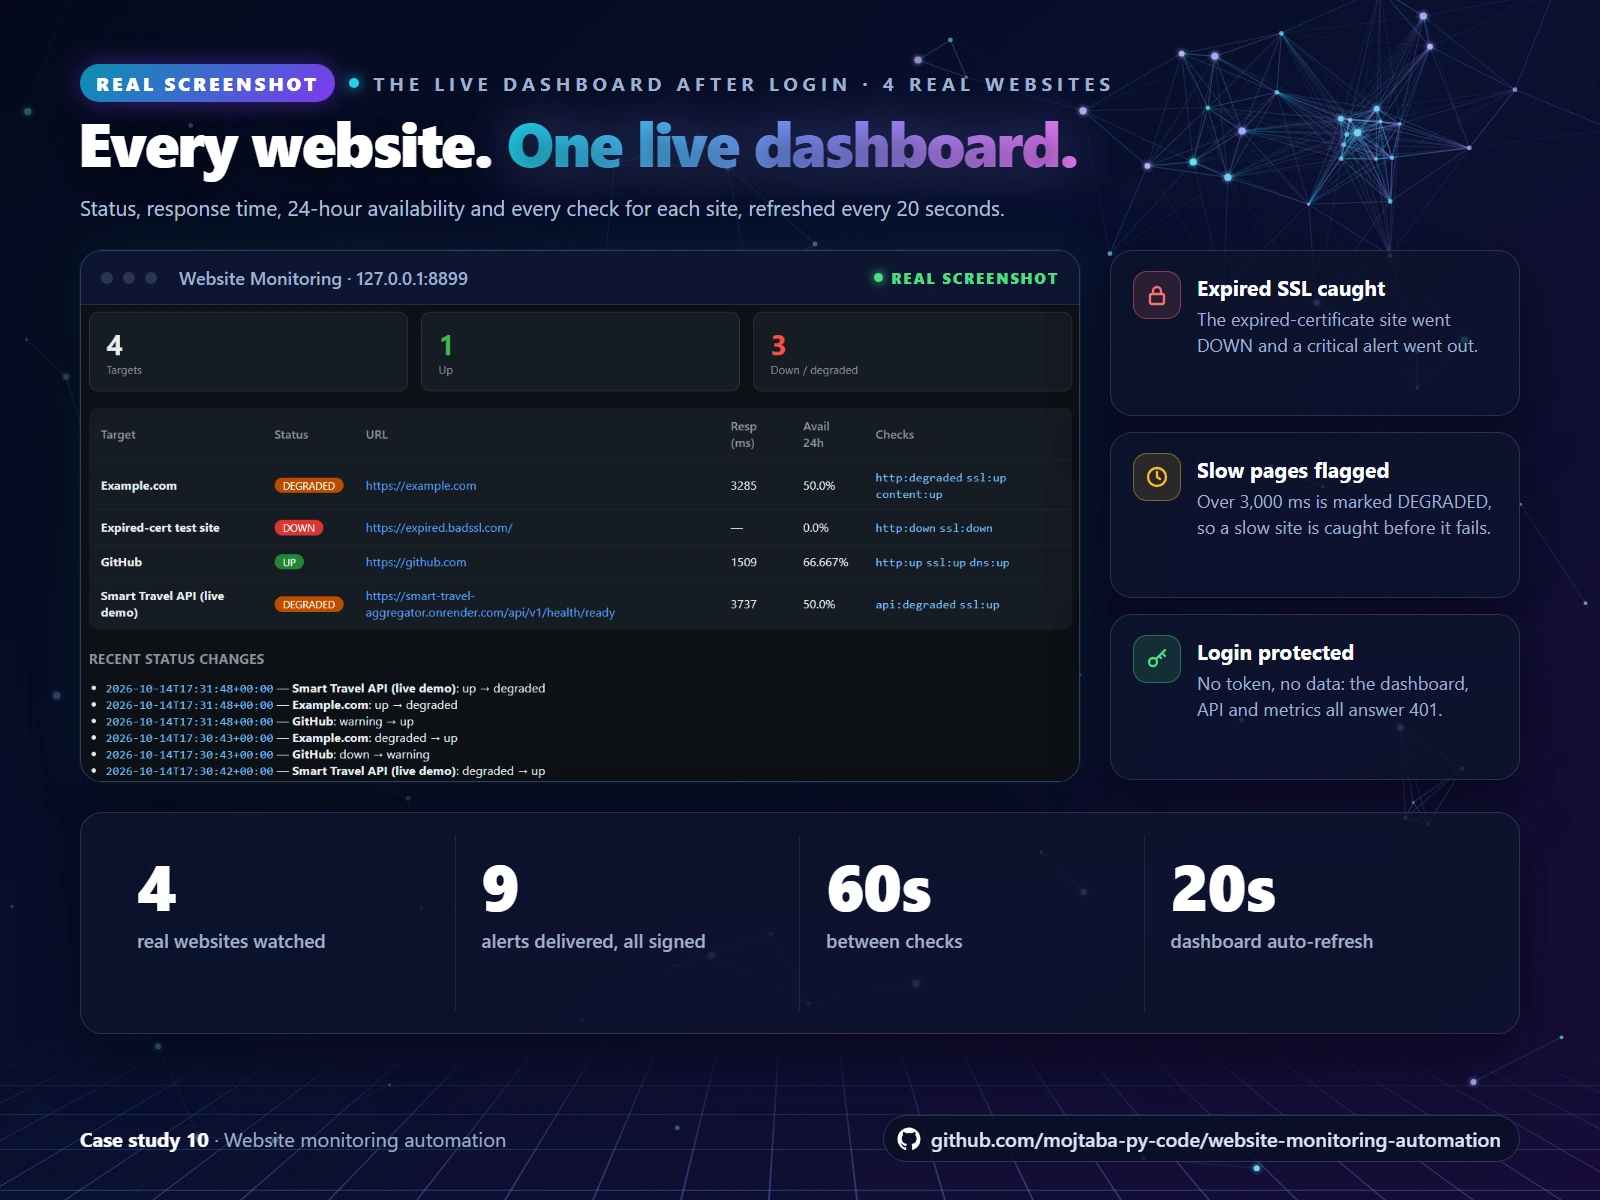
The real dashboard after login: status, response time, 24-hour availability and every check for each website, refreshed every 20 seconds.
The challenge
When a website goes down, its SSL certificate expires or a page becomes very slow, the owner often hears about it from an angry customer. By then sales and trust are already lost, and checking by hand every day does not scale.
The solution
I built a website monitoring tool in Python that checks websites and APIs every minute, catches downtime, slow pages, expiring SSL certificates and DNS changes, and sends an alert to Telegram, Slack, Discord, e-mail or a webhook.
The dashboard
4 real websites watched in this run, including my own live API demo and a test site with an expired certificate.
Status, response time, 24-hour availability and every check result for each site, refreshed every 20 seconds.
Pages slower than 3,000 ms are marked DEGRADED, so a slow site is caught before it fails completely.
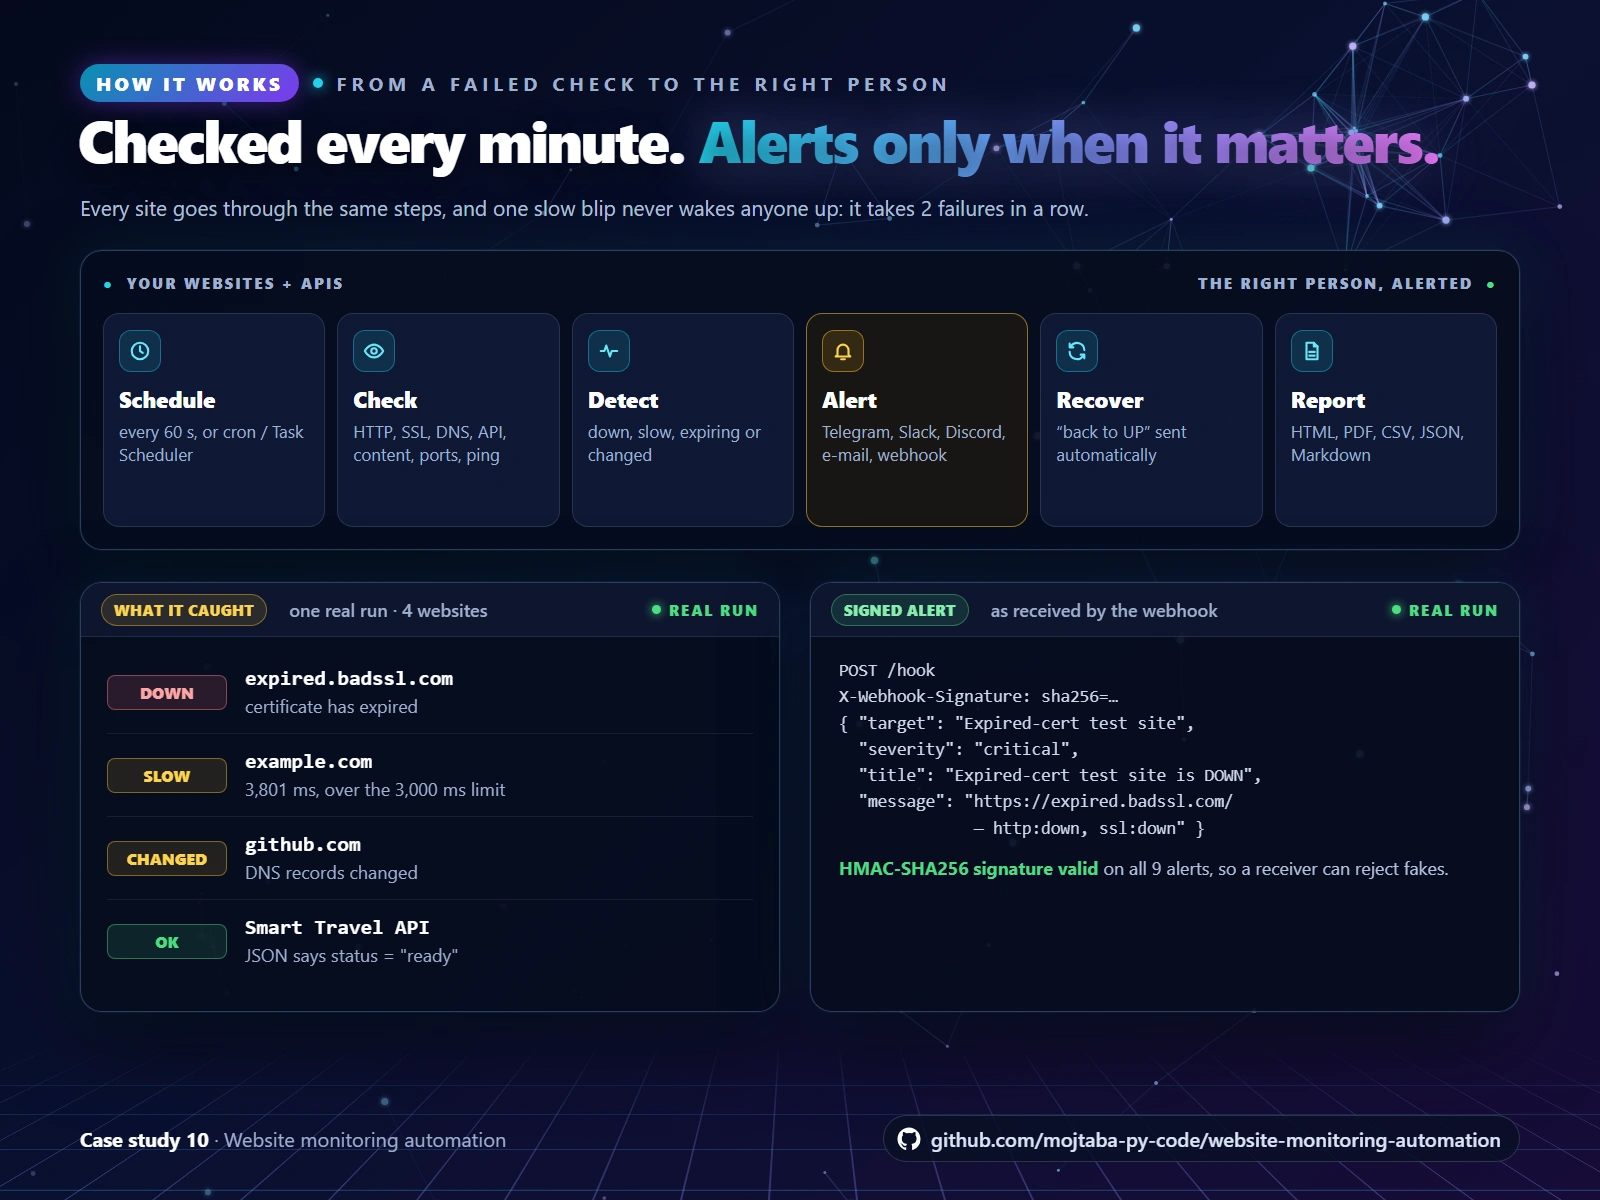
Six steps from check to alert, with real results: what the monitor caught and the signed alert exactly as the webhook received it.
How it works
Schedule: every website is checked on its own interval (60 seconds here), or one cycle runs from cron or Windows Task Scheduler.
Check: 7 kinds of checks: HTTP status and keywords, SSL expiry, DNS records, JSON API values, a page fingerprint (SHA-256), open ports and ping.
Detect: in the real run it caught an expired certificate, a page taking 3,801 ms and a DNS change on github.com.
Alert without noise: an alert fires only after 2 failures in a row, and a "back to UP" message follows automatically when the site recovers.
Signed alerts: every webhook alert carries an HMAC-SHA256 signature; all 9 alerts in this run arrived with a valid signature.
Reports: HTML, PDF, CSV, JSON and Markdown from the same run, with the full history kept in SQLite.
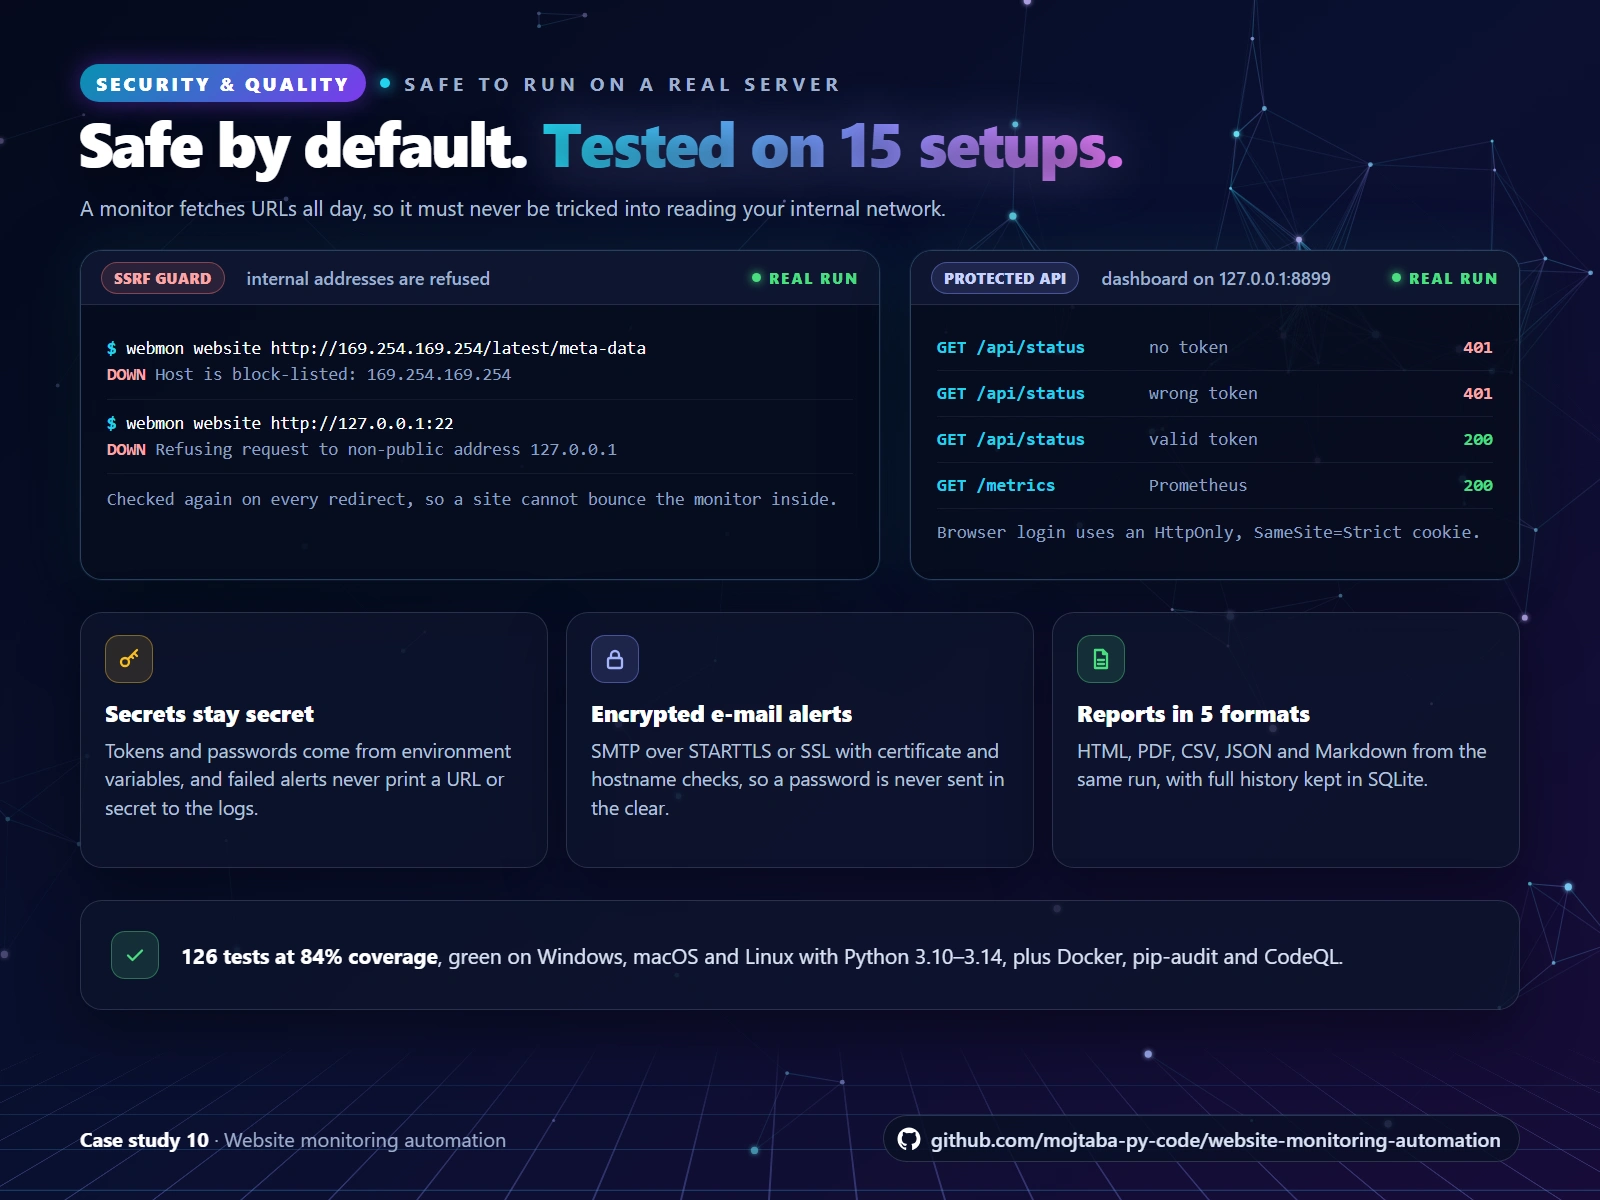
Real refusals from the SSRF guard, a token-protected dashboard and API, and 126 tests passing on Windows, macOS and Linux.
Security and quality
SSRF guard: the monitor refuses private and internal addresses, such as the cloud metadata address 169.254.169.254 and 127.0.0.1, and checks every redirect again.
Protected dashboard: without a valid token the dashboard, API and metrics answer 401, and the browser login uses an HttpOnly, SameSite=Strict cookie.
Secrets come from environment variables and never reach the logs; e-mail alerts use STARTTLS or SSL with certificate checks.
Prometheus /metrics for Grafana or any other monitoring stack.
126 automated tests at 84% coverage, green on Windows, macOS and Linux with Python 3.10 to 3.14, plus Docker, pip-audit and CodeQL.
Tech stack: Python, asyncio, httpx, FastAPI, Pydantic, dnspython, SQLite and Docker.
Want your websites, online store or APIs watched around the clock? Send me a message with the sites you want to monitor.
Like this project
Posted Oct 14, 2026
Checks websites and APIs every minute for downtime, slow pages, SSL expiry and DNS changes, then alerts Slack, Telegram or e-mail. 126 tests.