
A single year of wholesale transactions contained discounts and returns alongside regular sales. I built the transaction ledger so that a return reverses both revenue and cost of goods. Gross profit is the difference between those two signed totals, and gross margin uses net sales as the denominator.
The reporting view
The category selector updates the monthly series, chart and dashboard KPIs together. Separate tables report results by category, product and account. Control totals reconcile each of those three views back to the same transaction ledger.
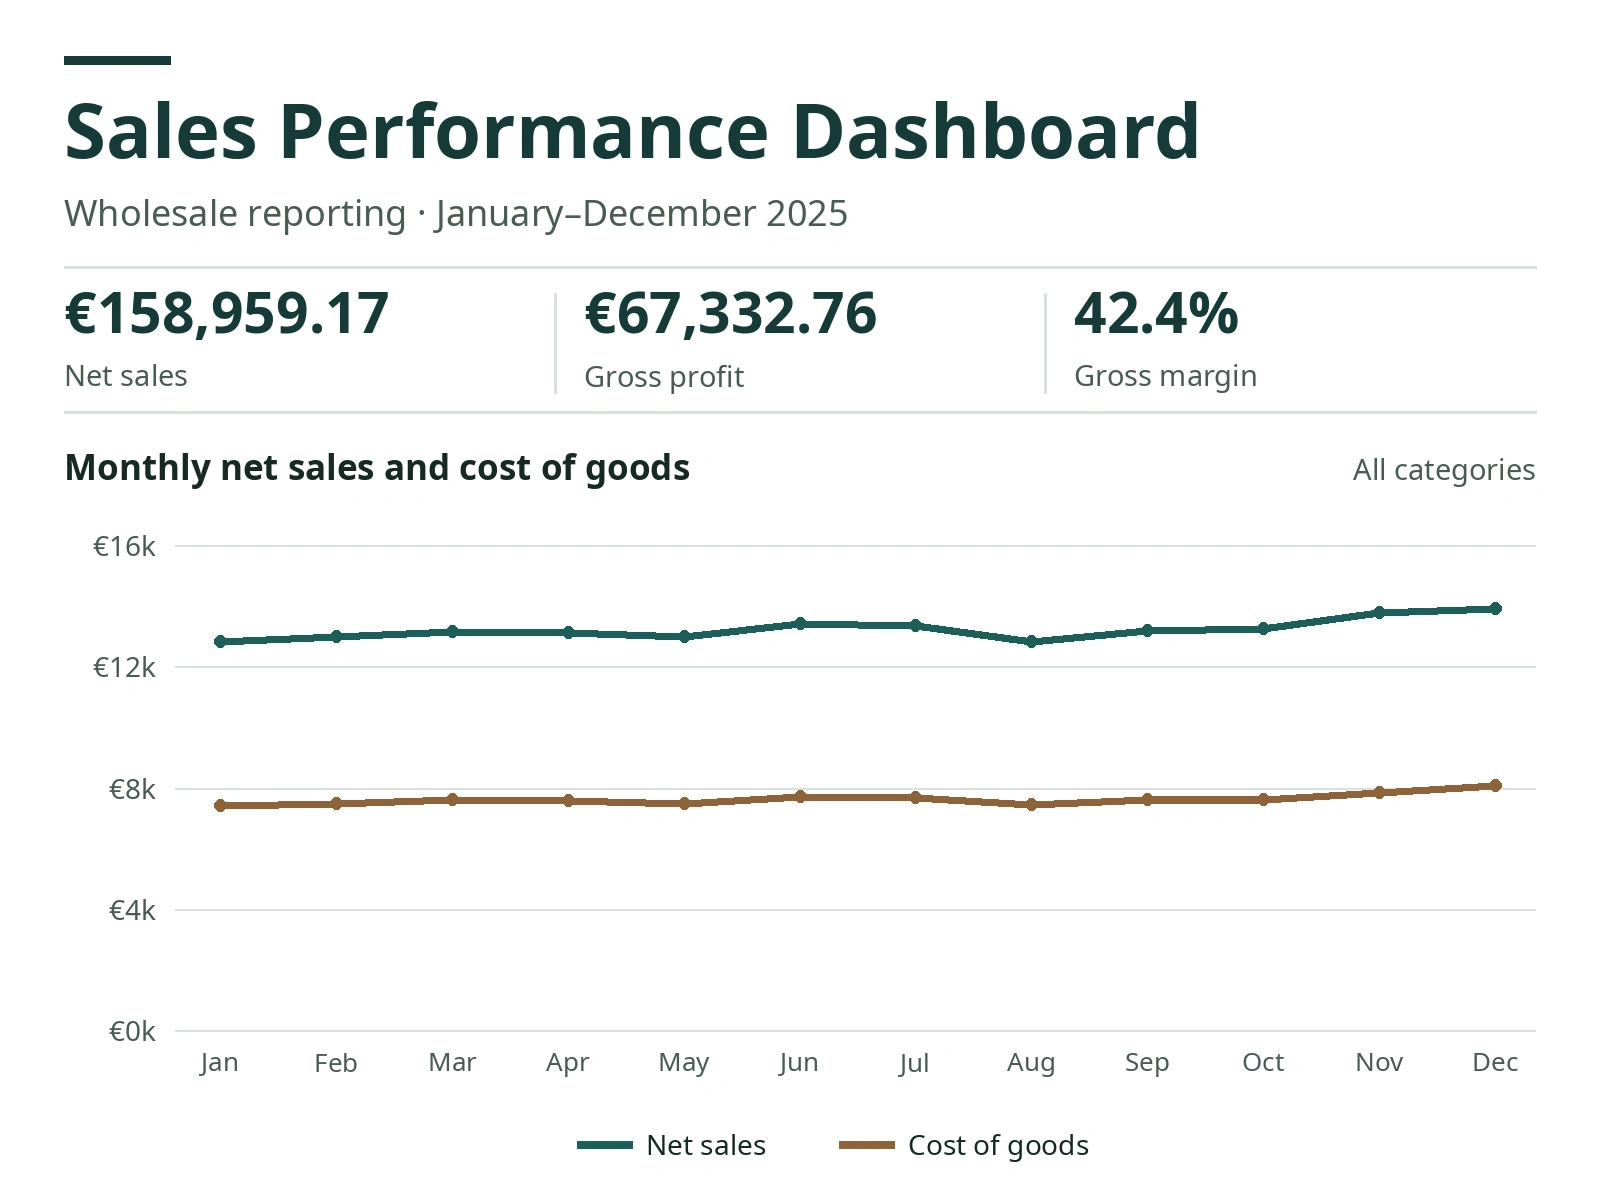
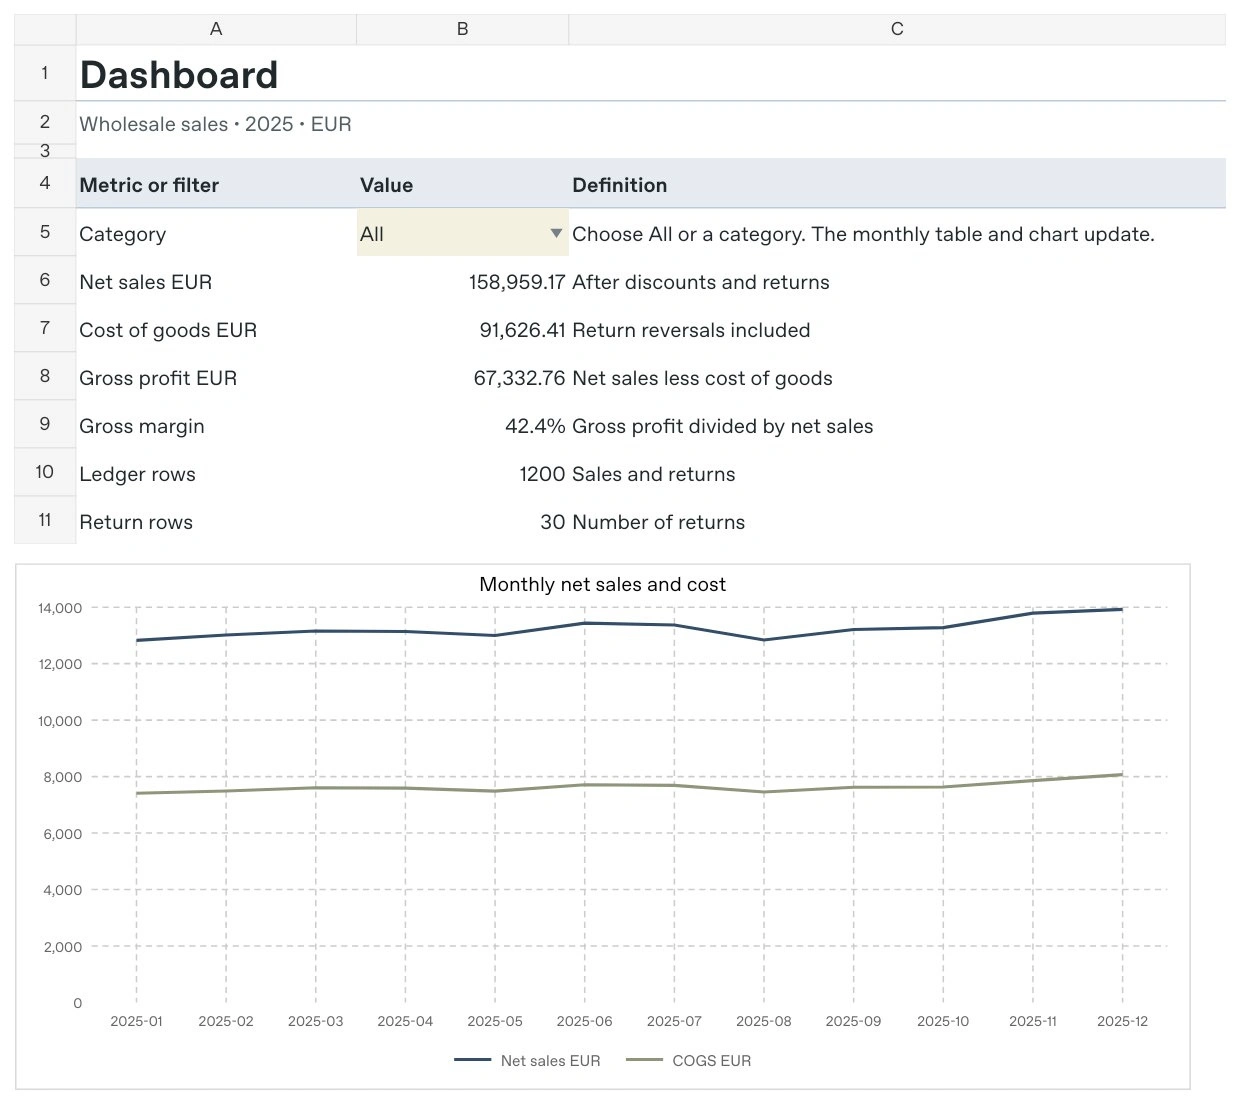
Excel dashboard with the category selector and monthly revenue and cost chart.
The annual view
Across 1,200 transactions, including 30 returns, the workbook shows €158,959.17 in net sales, €91,626.41 in cost of goods and €67,332.76 in gross profit. Gross margin is 42.4% at one decimal place. The linked Excel file includes the source transactions, formulas and reconciliation checks.
0 likes · 0 views · Nov 17, 2026
Interactive Excel dashboard for 1,200 sales and returns. A category selector updates twelve months of net sales, cost, gross profit and margin.
