PULSE

Prakhar Dewangan


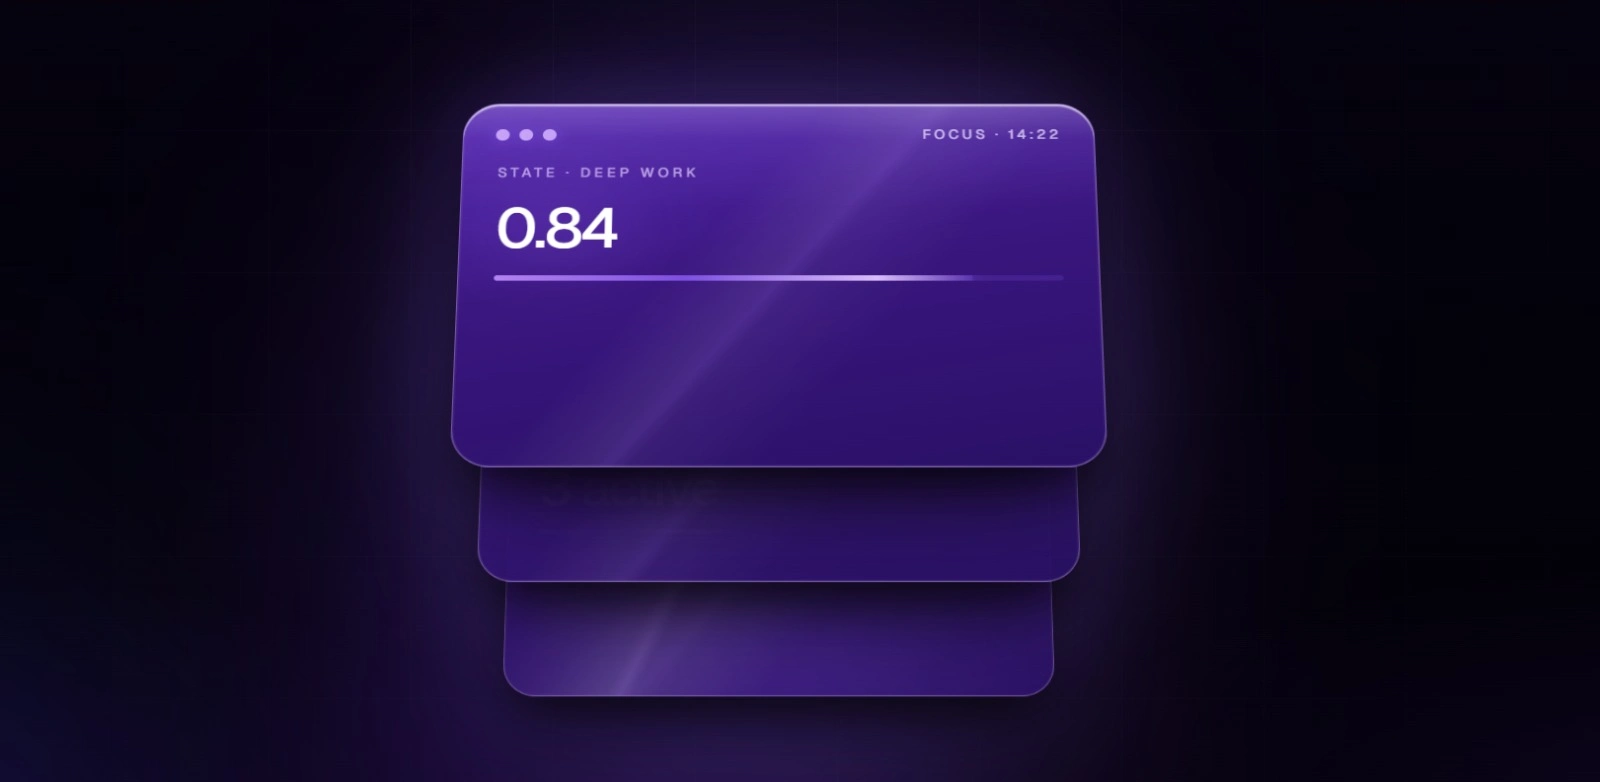
Product · Engineering HealthWeb App (team console)2025
PULSE
You can’t hear a team through a dashboard. You feel it through a pulse.
OutcomeCycle time: 6.1d → 3.4d (−44%)
DetailsFocus time +38% · meetings −27% · adopted by 9/10 pilot squads
RoleProduct Designer — end to end
StackFigma · React · D3 · Framer Motion
The problem
Engineering leaders are asked to answer one question every week — “how is the team, really?” — and the honest answer is usually a guess. DORA dashboards report the past, retros surface feelings, and 1:1s catch what people are willing to say out loud. None of them tell you, on a Tuesday afternoon, whether the team is actually shipping, or quietly grinding to a halt.
Who it’s for
Engineering managers and staff leads at 20–200-person orgs who care about outcomes, not surveillance — people who want a truthful read on velocity, friction, and focus so they can protect their team instead of poking it.
The product
Pulse reads the artefacts a team already produces — commits, PRs, tickets, calendar, incidents — and models three things: momentum (are we shipping?), friction (where is work stuck?), and focus (is the team allowed to think?). A single heartbeat view shows the week at a glance; a friction map points to the exact PR, ticket, or meeting cluster that is dragging the number; and a private manager brief suggests the smallest intervention that will move it.
It is opinionated: no per-person leaderboards, no productivity scores, no green-red judgement. The unit of measurement is the team, not the individual.
Key decisions
Team-only metrics by default (individuals stay private), a friction map instead of a scoreboard, and a weekly brief that recommends one change rather than ten. The design brief was “a stethoscope, not a surveillance camera.”
Outcome
Across ten pilot squads, cycle time fell from 6.1 to 3.4 days (−44%), focus time rose 38%, and recurring meetings dropped 27%. Nine of ten teams kept using it after the pilot ended — the strongest signal that the read felt truthful.
Reflection
The hardest calls were what not to build. Every stakeholder wanted an individual score; refusing it is what made managers trust the tool enough to actually act on what it said.
Let's build something great.
Like this project
Posted Jul 29, 2026
A heartbeat for engineering teams to measure velocity, friction, and focus; cycle time fell from 6.1 to 3.4 days in pilots.
Likes
0
Views
0