
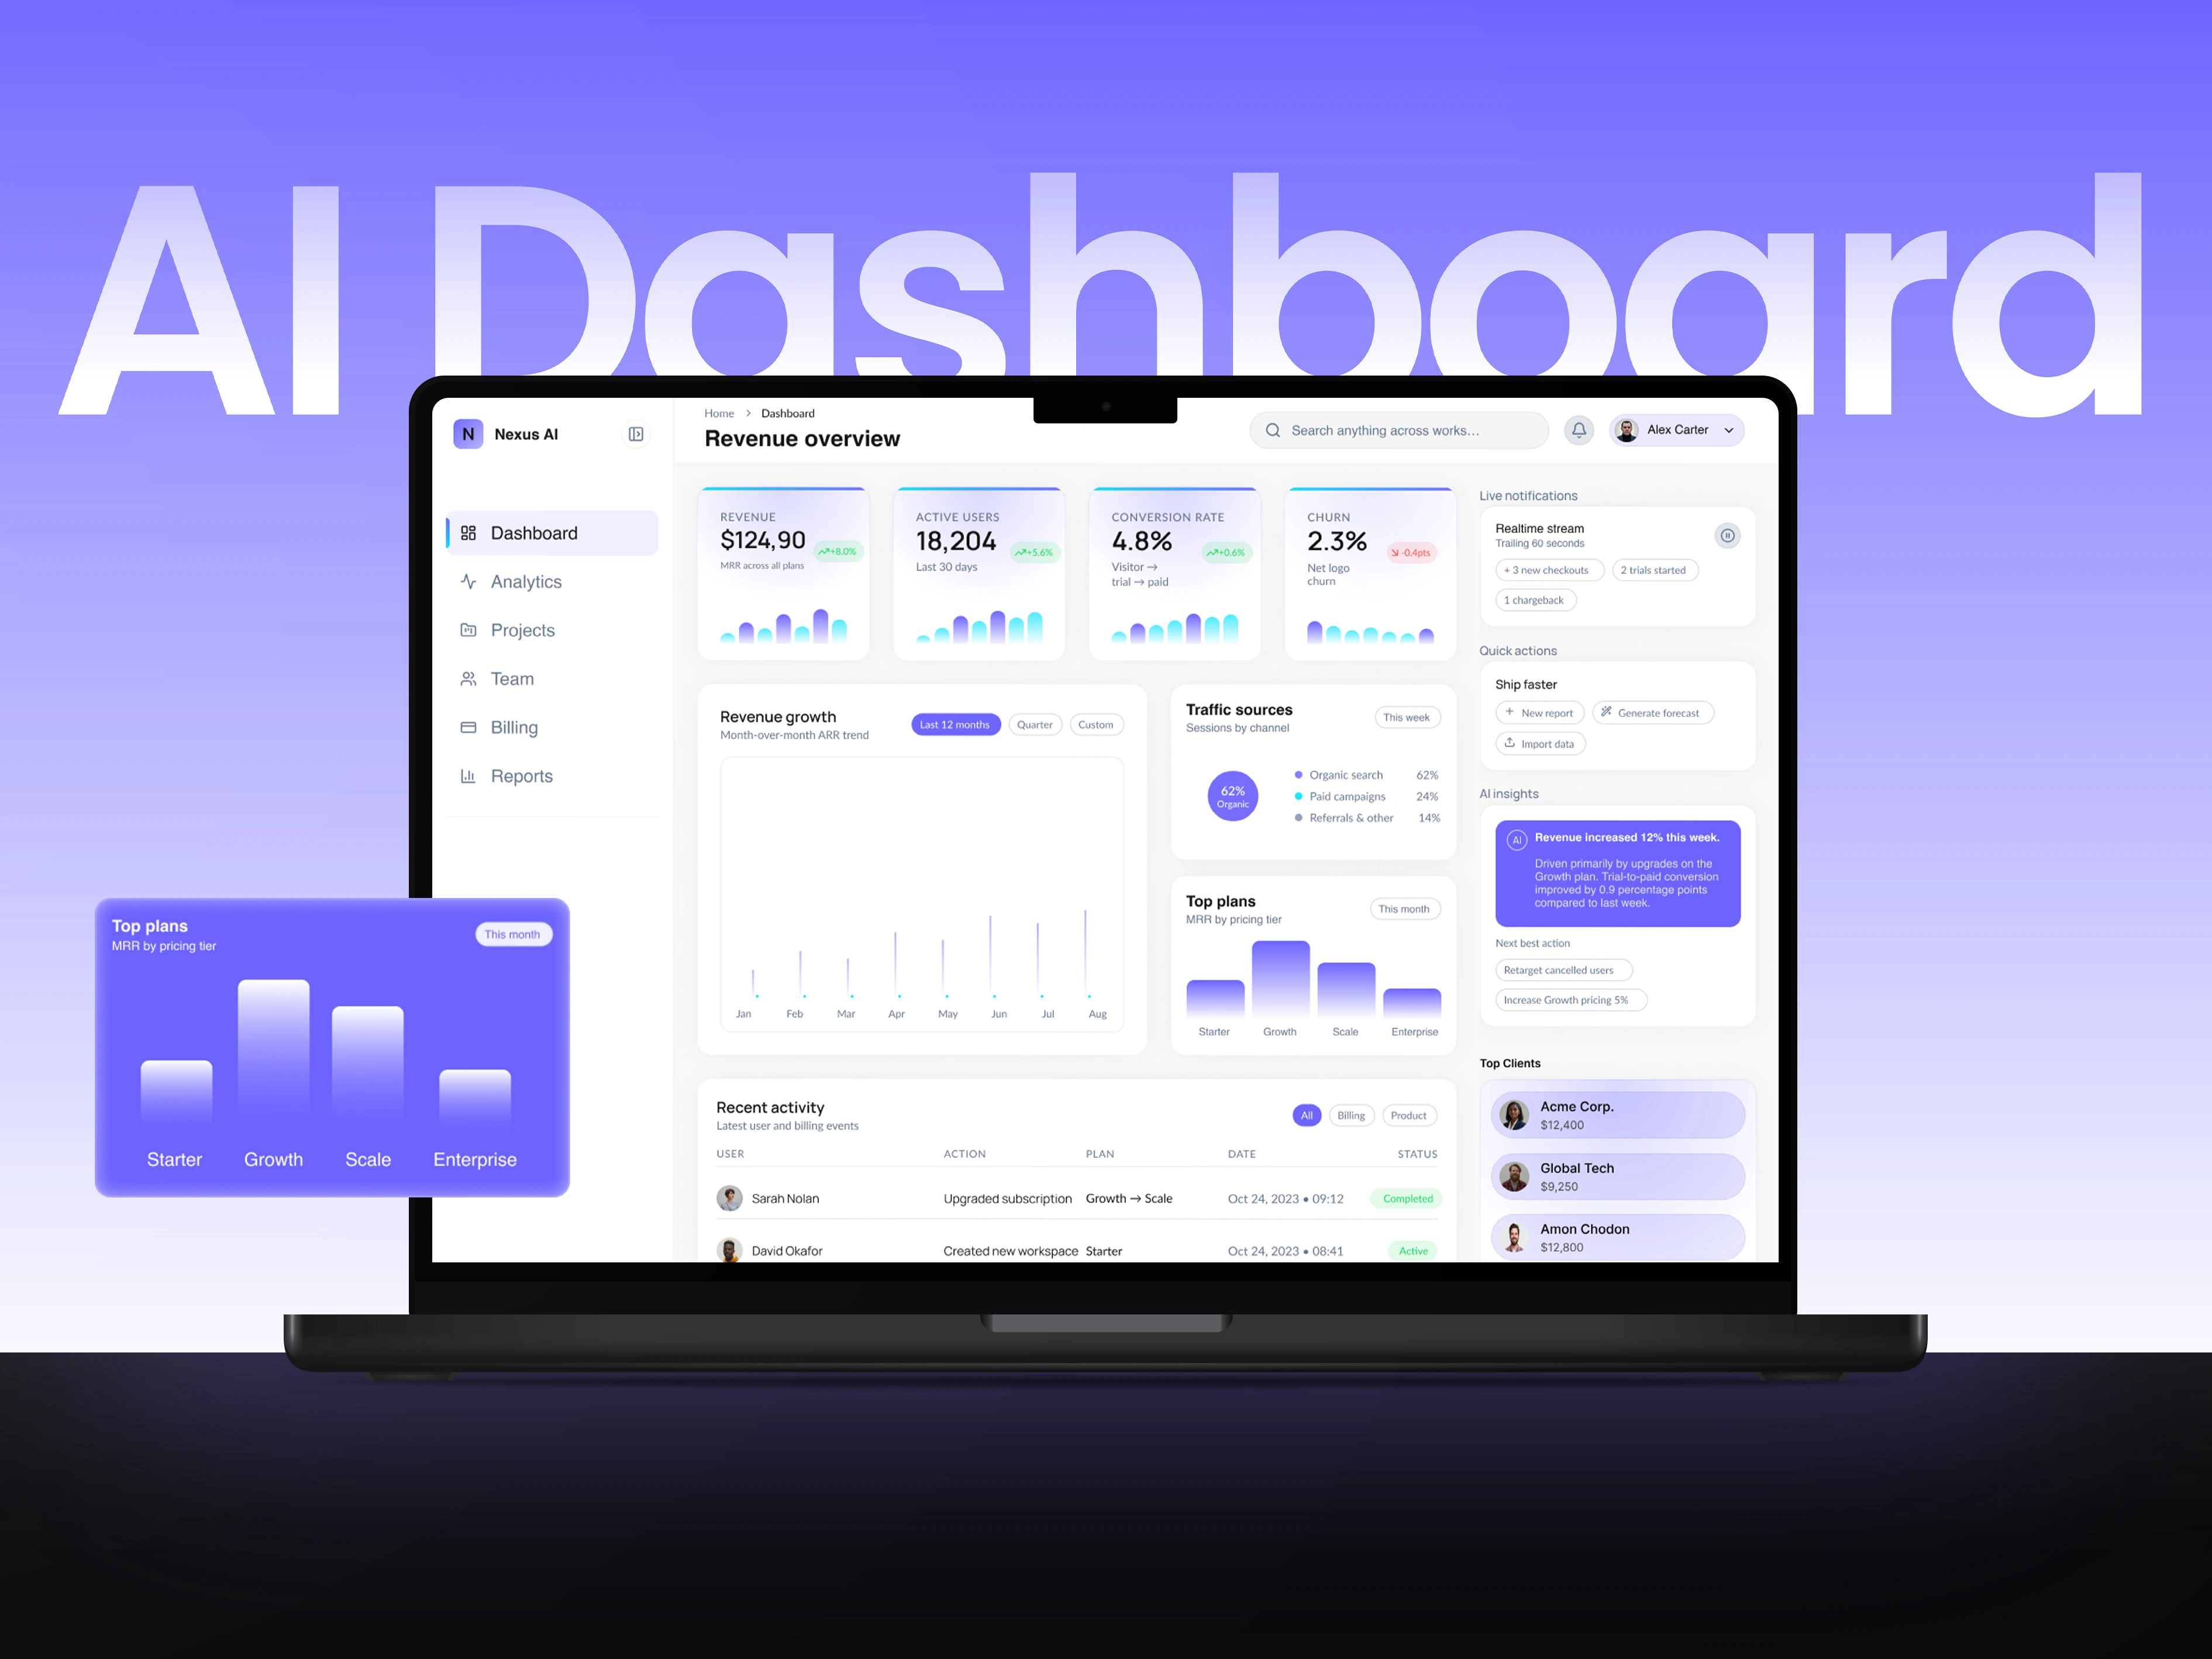
Nexus AI — SaaS Analytics Dashboard UI Design
THE DESIGN CHALLENGE
An analytics dashboard needs to show multiple metrics without giving every panel equal weight. The challenge is to separate headline figures, trends and operational detail into a clear information hierarchy.
THE DESIGN SOLUTION
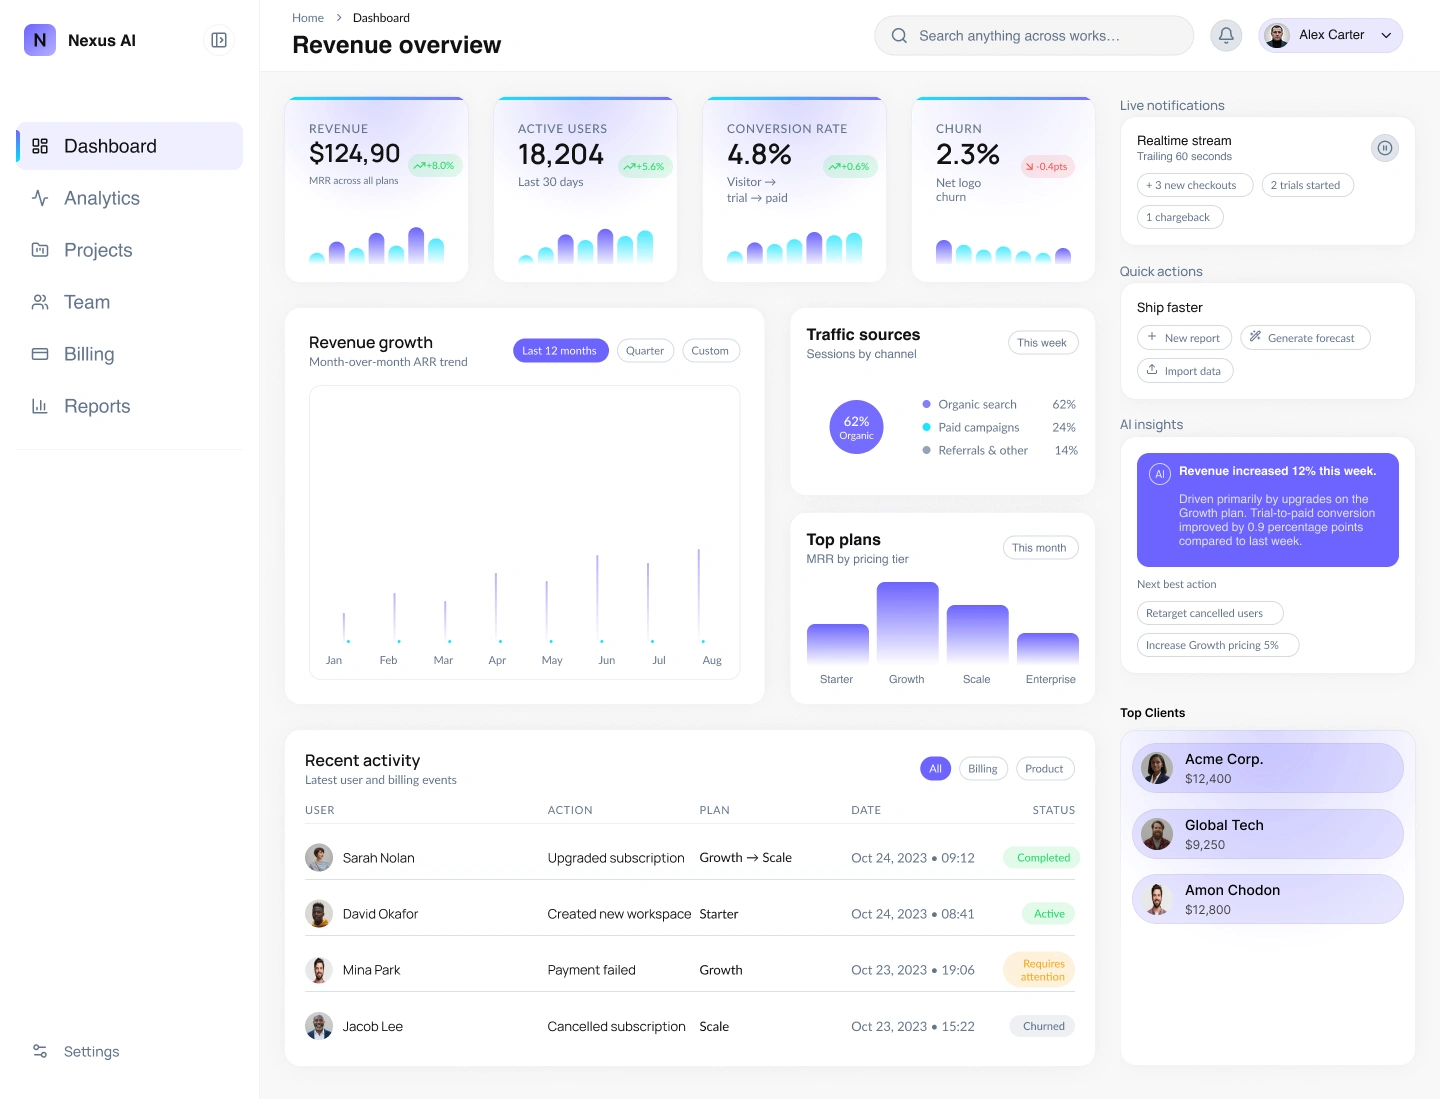
The dashboard groups MRR, active users, conversion and churn in a consistent top-row card system. A larger revenue chart anchors the content below, supported by traffic, plans and activity panels. A persistent sidebar, pale surfaces and purple accents organise navigation and selected information.
WHY THESE DECISIONS MATTER
Larger figures establish priority while smaller labels and charts provide context. Grouped metrics and distinct panel sizes give the dashboard a clear overview-to-detail structure.
Need SaaS dashboard UI design or data visualisation? Message me with your key metrics, user tasks and product requirements.
© February 2026
1 like · 9 views · Oct 16, 2026
SaaS analytics dashboard UI organising headline KPIs, revenue trends and operational detail through grouped cards and restrained purple accents.

