
Results after the setup, sample data
Concept piece. The dashboard uses sample data, not results from a real site.
After a setup goes live, the obvious question is whether it's doing anything. This dashboard answers it in one screen.
Two kinds of numbers
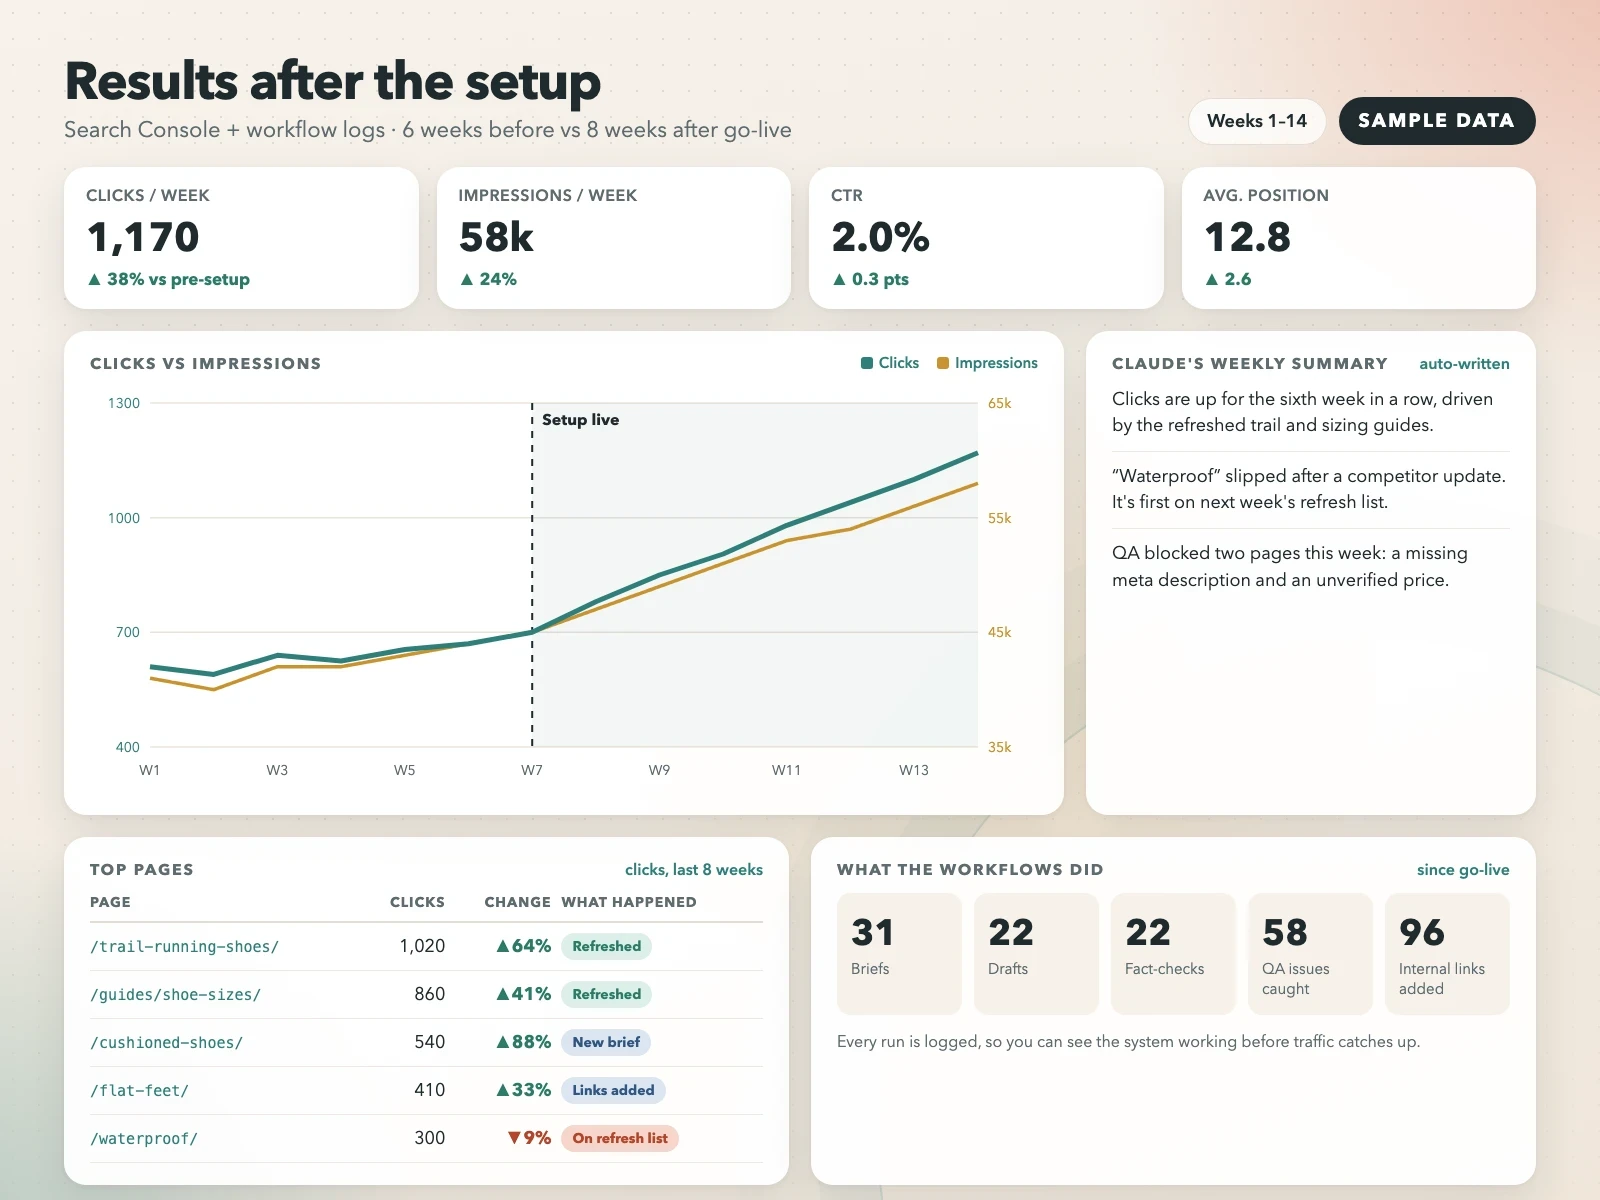
The chart shows organic clicks and impressions per week, with a line marking the week the setup went live. You can see the trend before and after without digging through Search Console.
The workflow panel counts the work itself: briefs, drafts, fact-checks, issues caught by QA and internal links added. Traffic takes time to move. These numbers show from week one whether the workflows are actually being used.
The weekly summary
Next to the chart, a Claude skill writes three or four plain sentences each week about what went up, what slipped and what's already on next week's list. Most people read that part and skip the chart, which is fine.
How it's built
Click data comes from Google Search Console. The workflow counts come from the skills themselves, because each run gets logged. Claude reads both every week and writes the summary. You keep the whole thing after handover, so it keeps running without me.
0 likes · 0 views · Nov 8, 2026
Concept piece with sample data. A dashboard that shows what happened after the Claude setup went live: traffic, plus what the workflows actually did.
