Disence: Partner Presentation Design for Web3 Agency
Anna Lezhnina
Project Overview
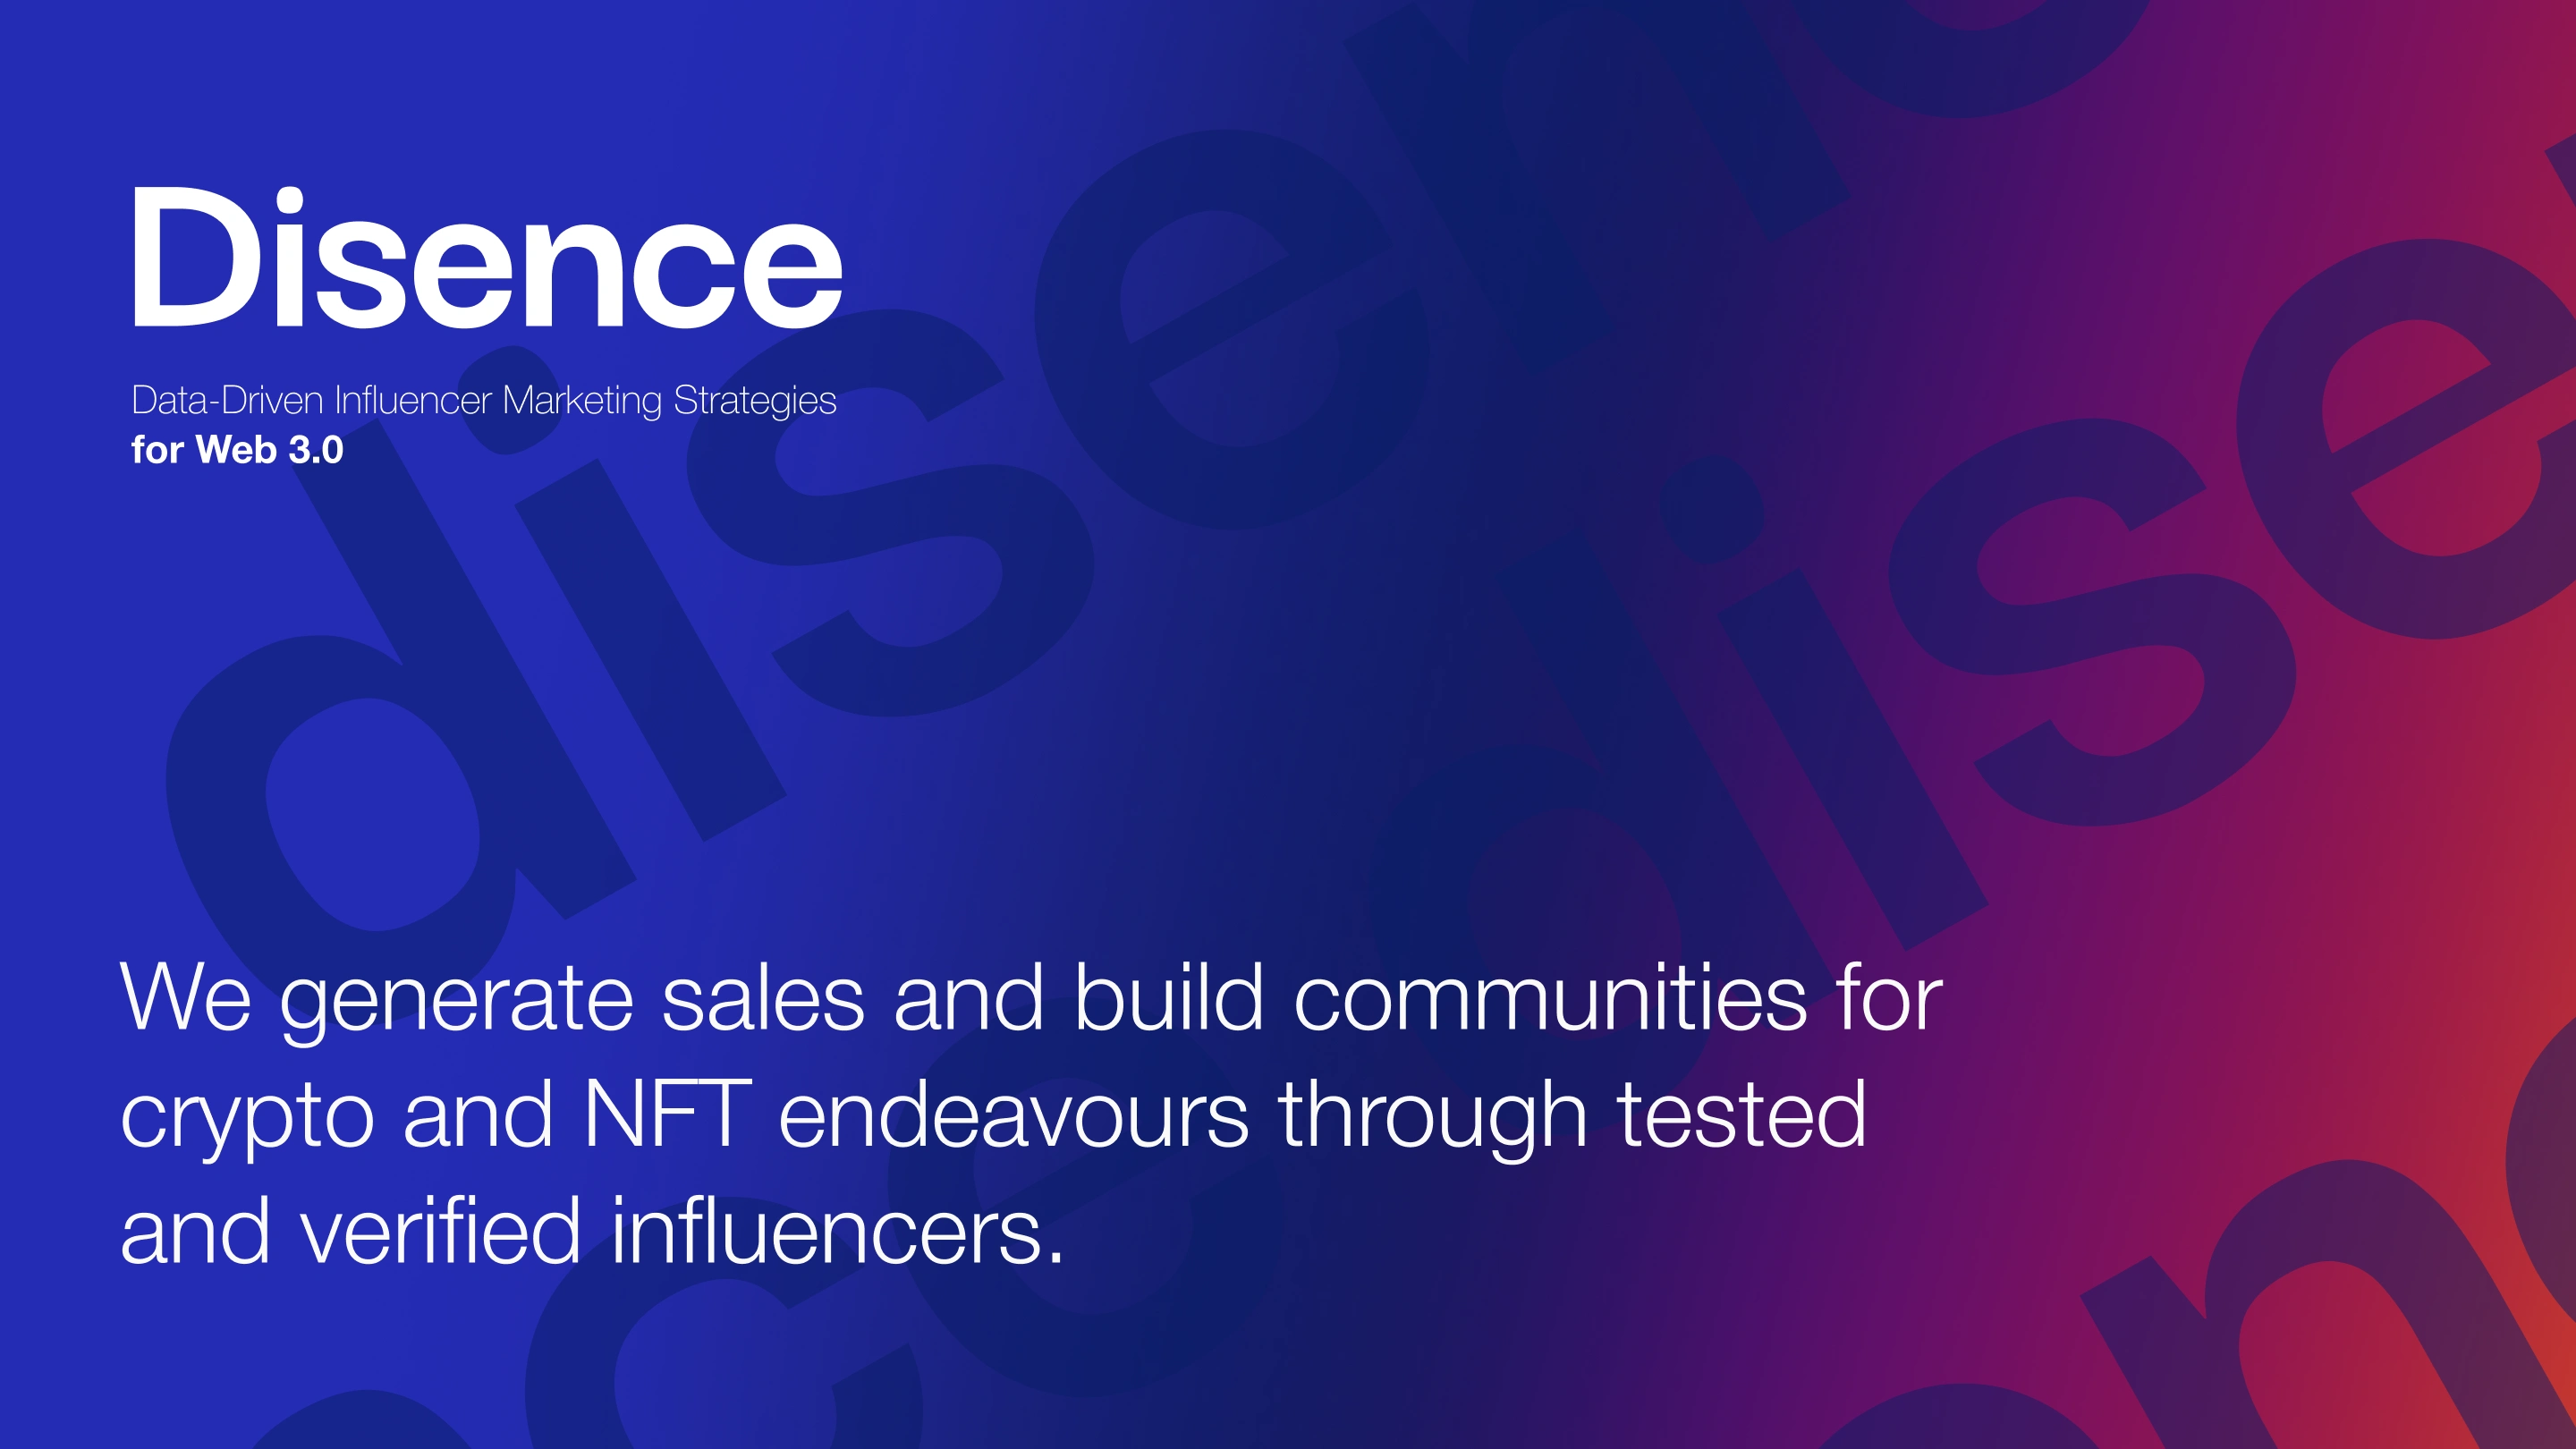
Presentation design for Disence — a web3 marketing agency recruiting partners through an affiliate program. The goal: package the offer into a visually clear presentation where partners understand the earning model and benefits within seconds.
What I did:
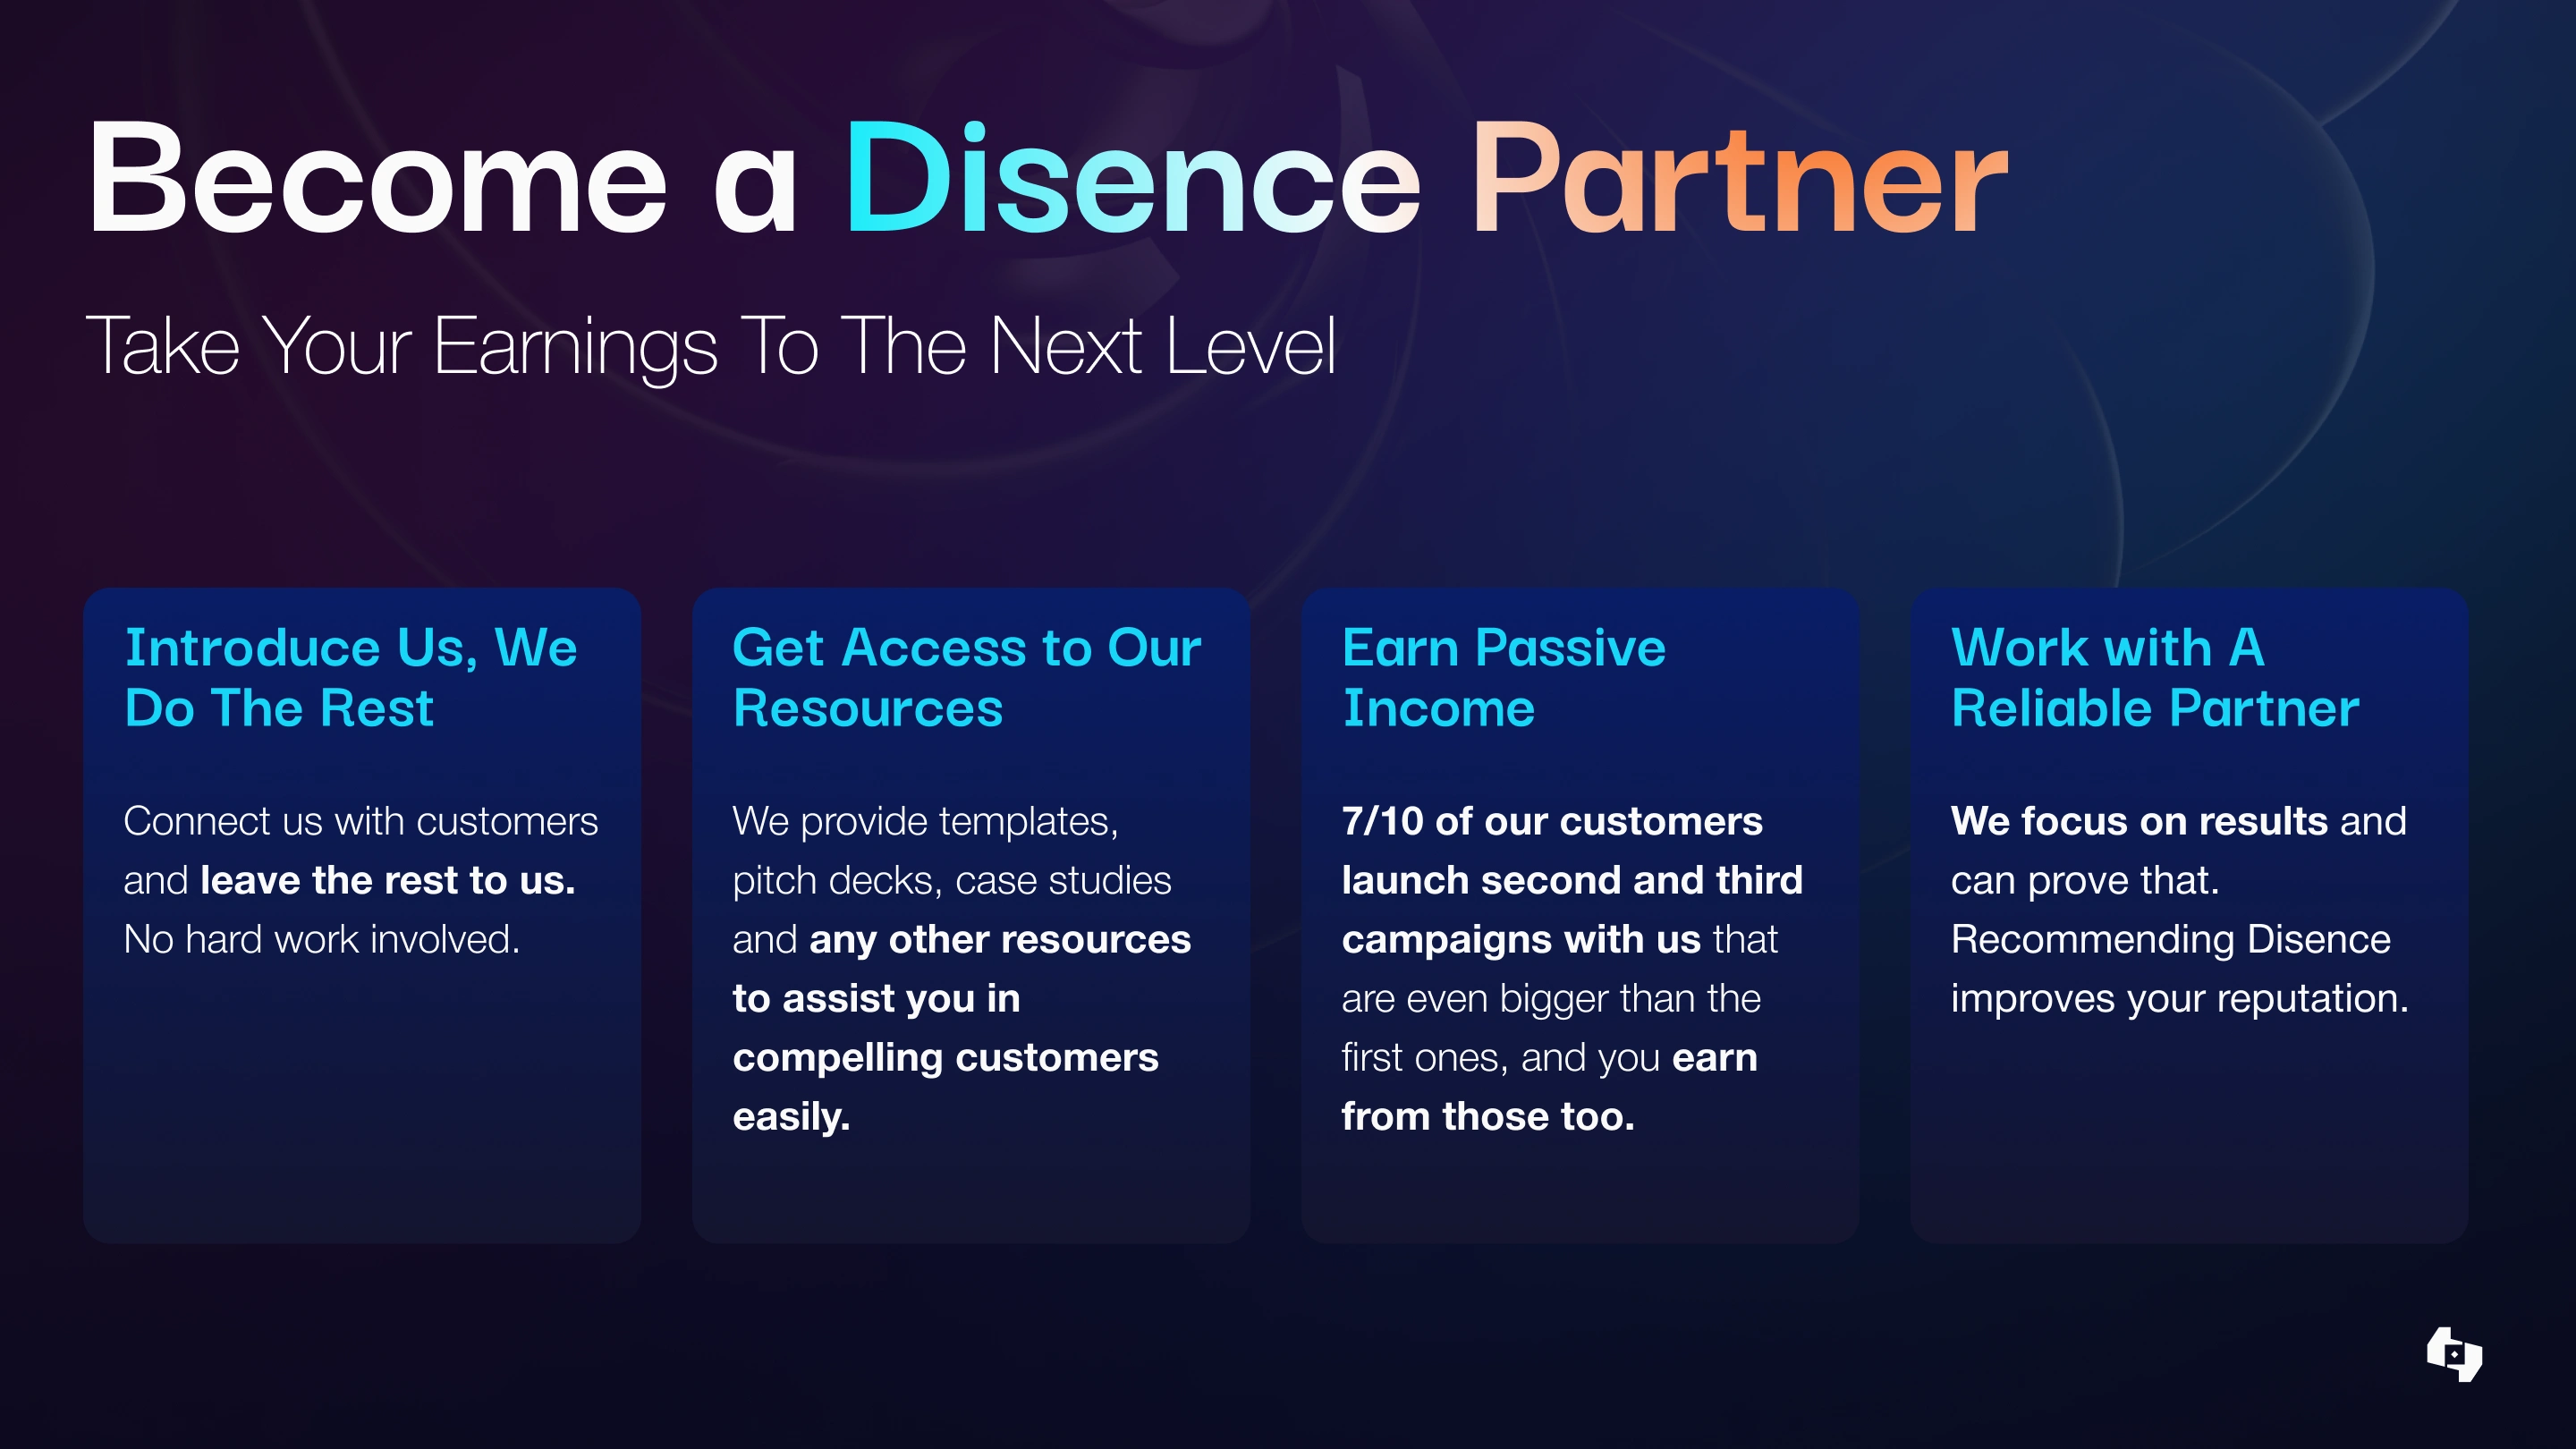
Slide structure: from main value proposition to benefits, earning mechanics, and CTA
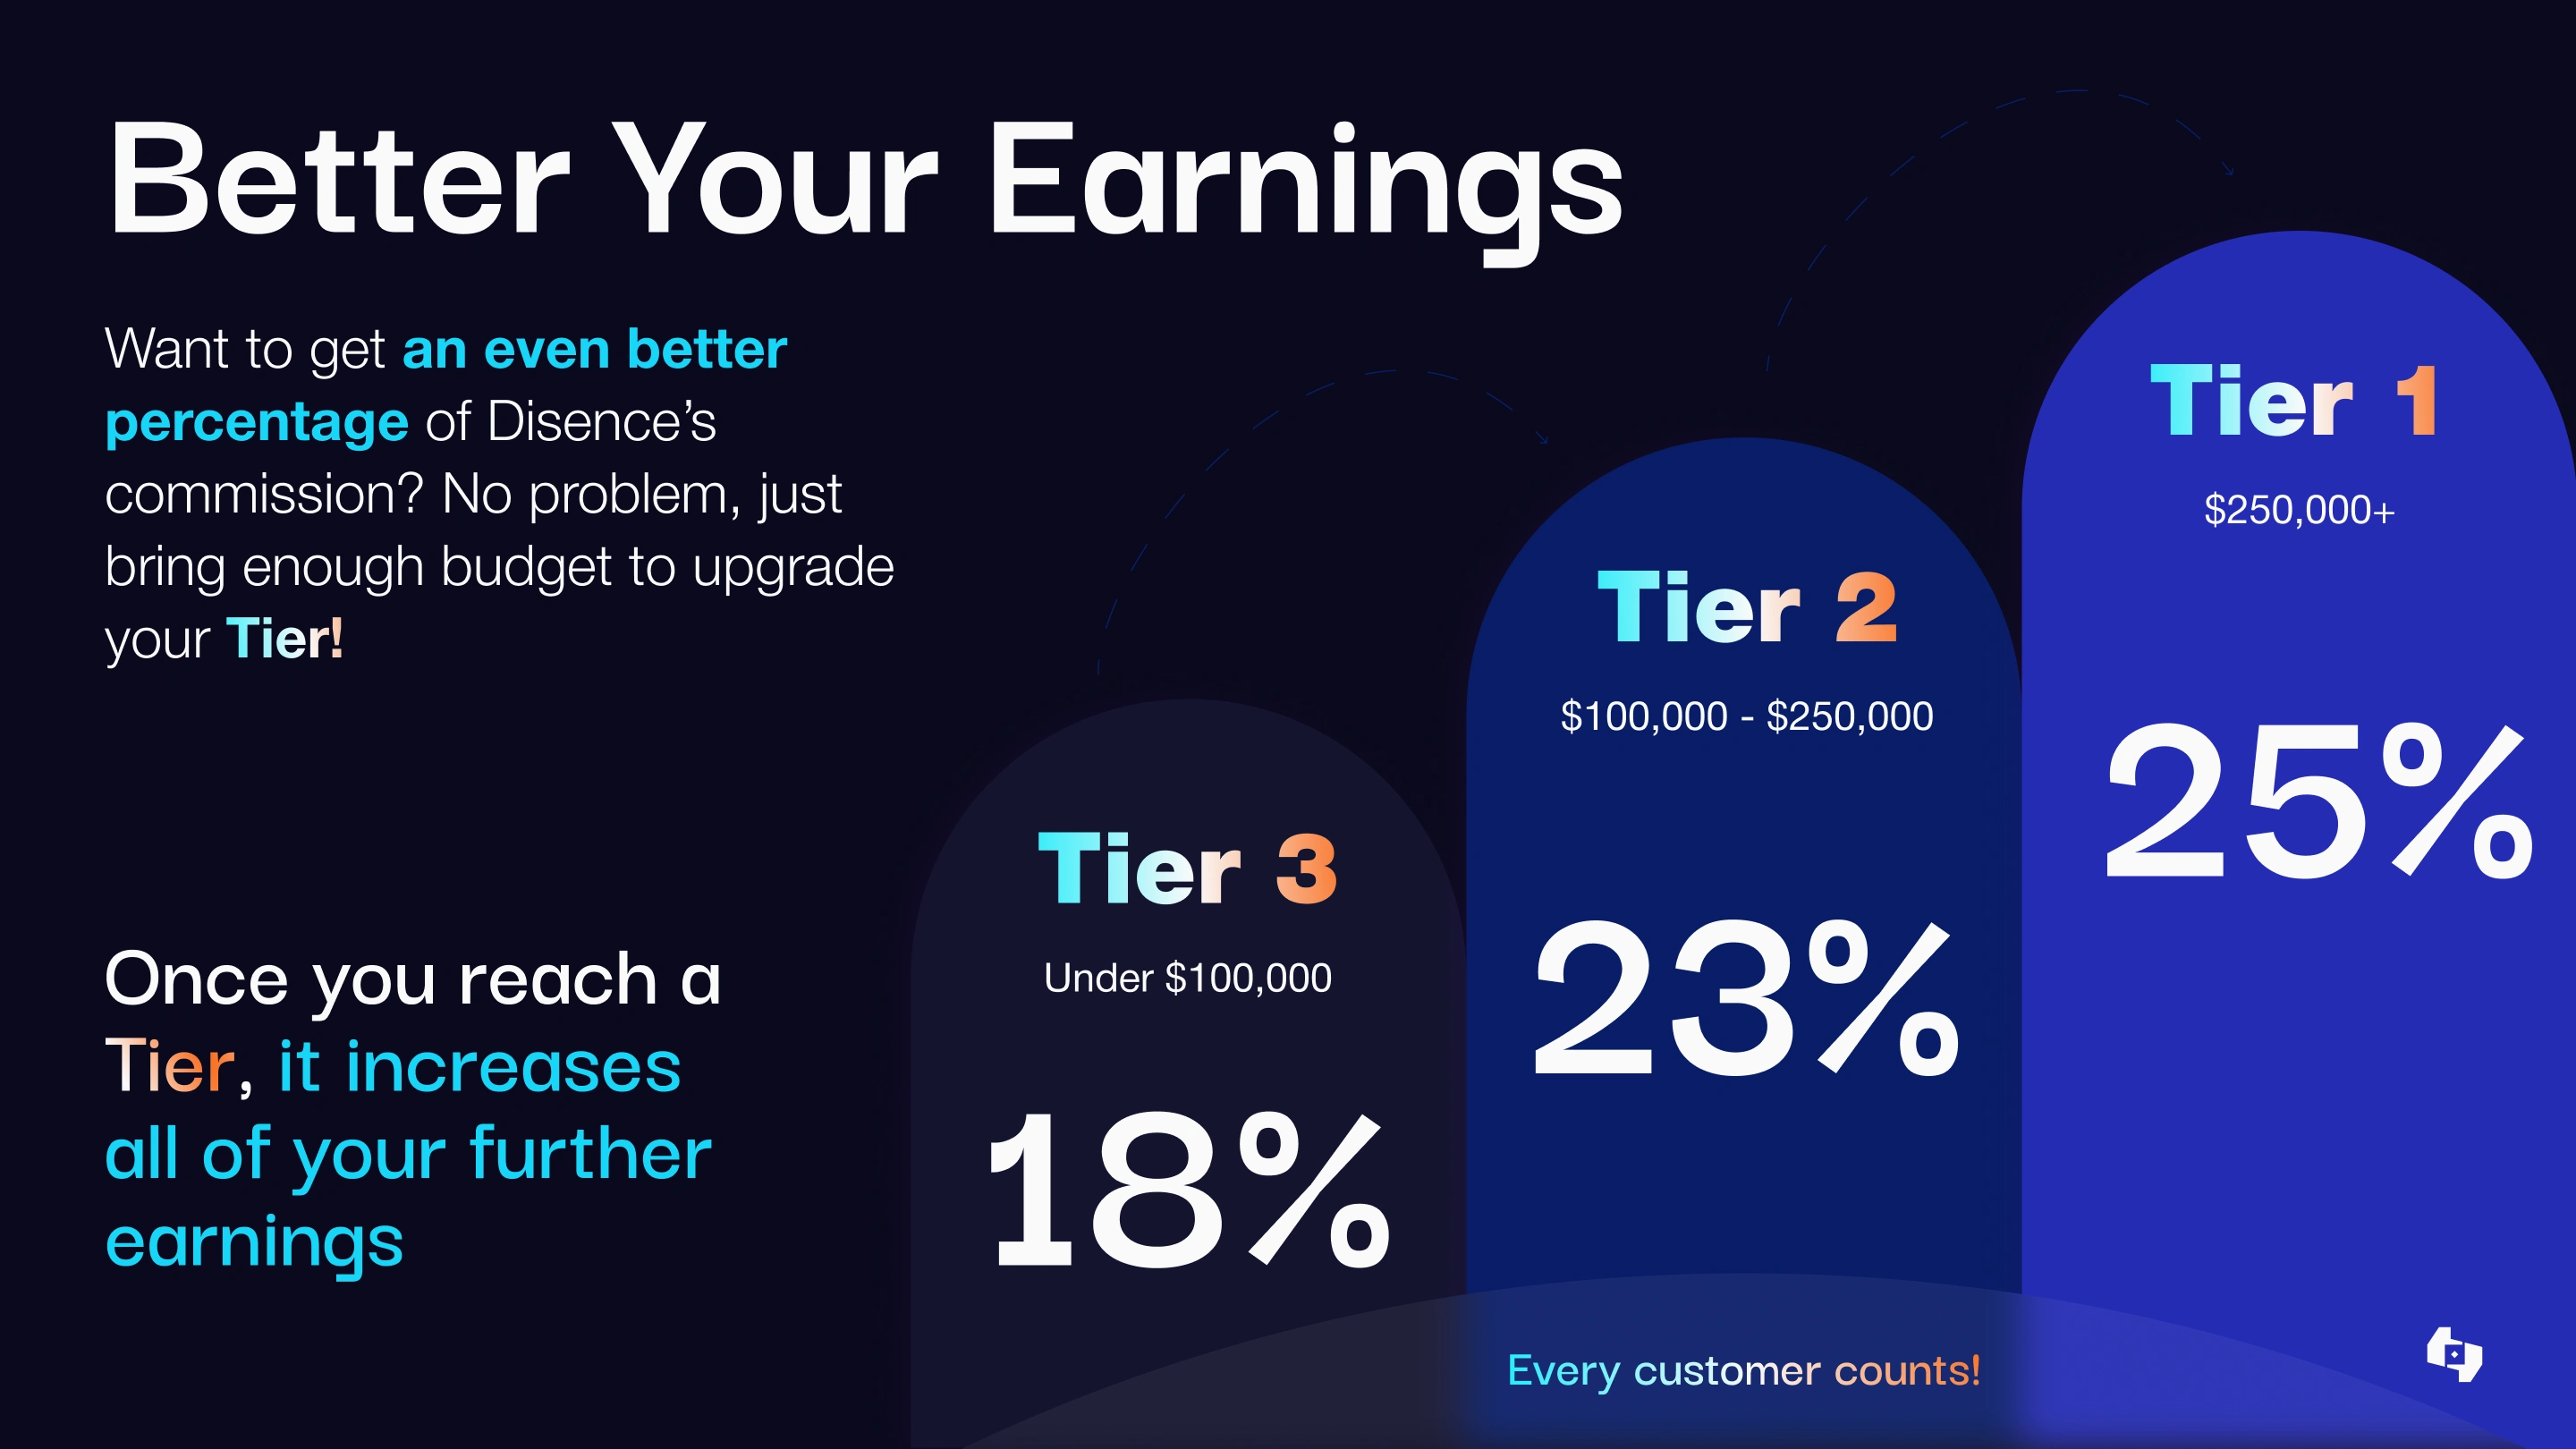
Visualised numbers: income progression table, tier system with percentages
Step-by-step process scheme with icons and arrows for quick comprehension
Typography: highlighted key numbers and headlines for scanning
Summary
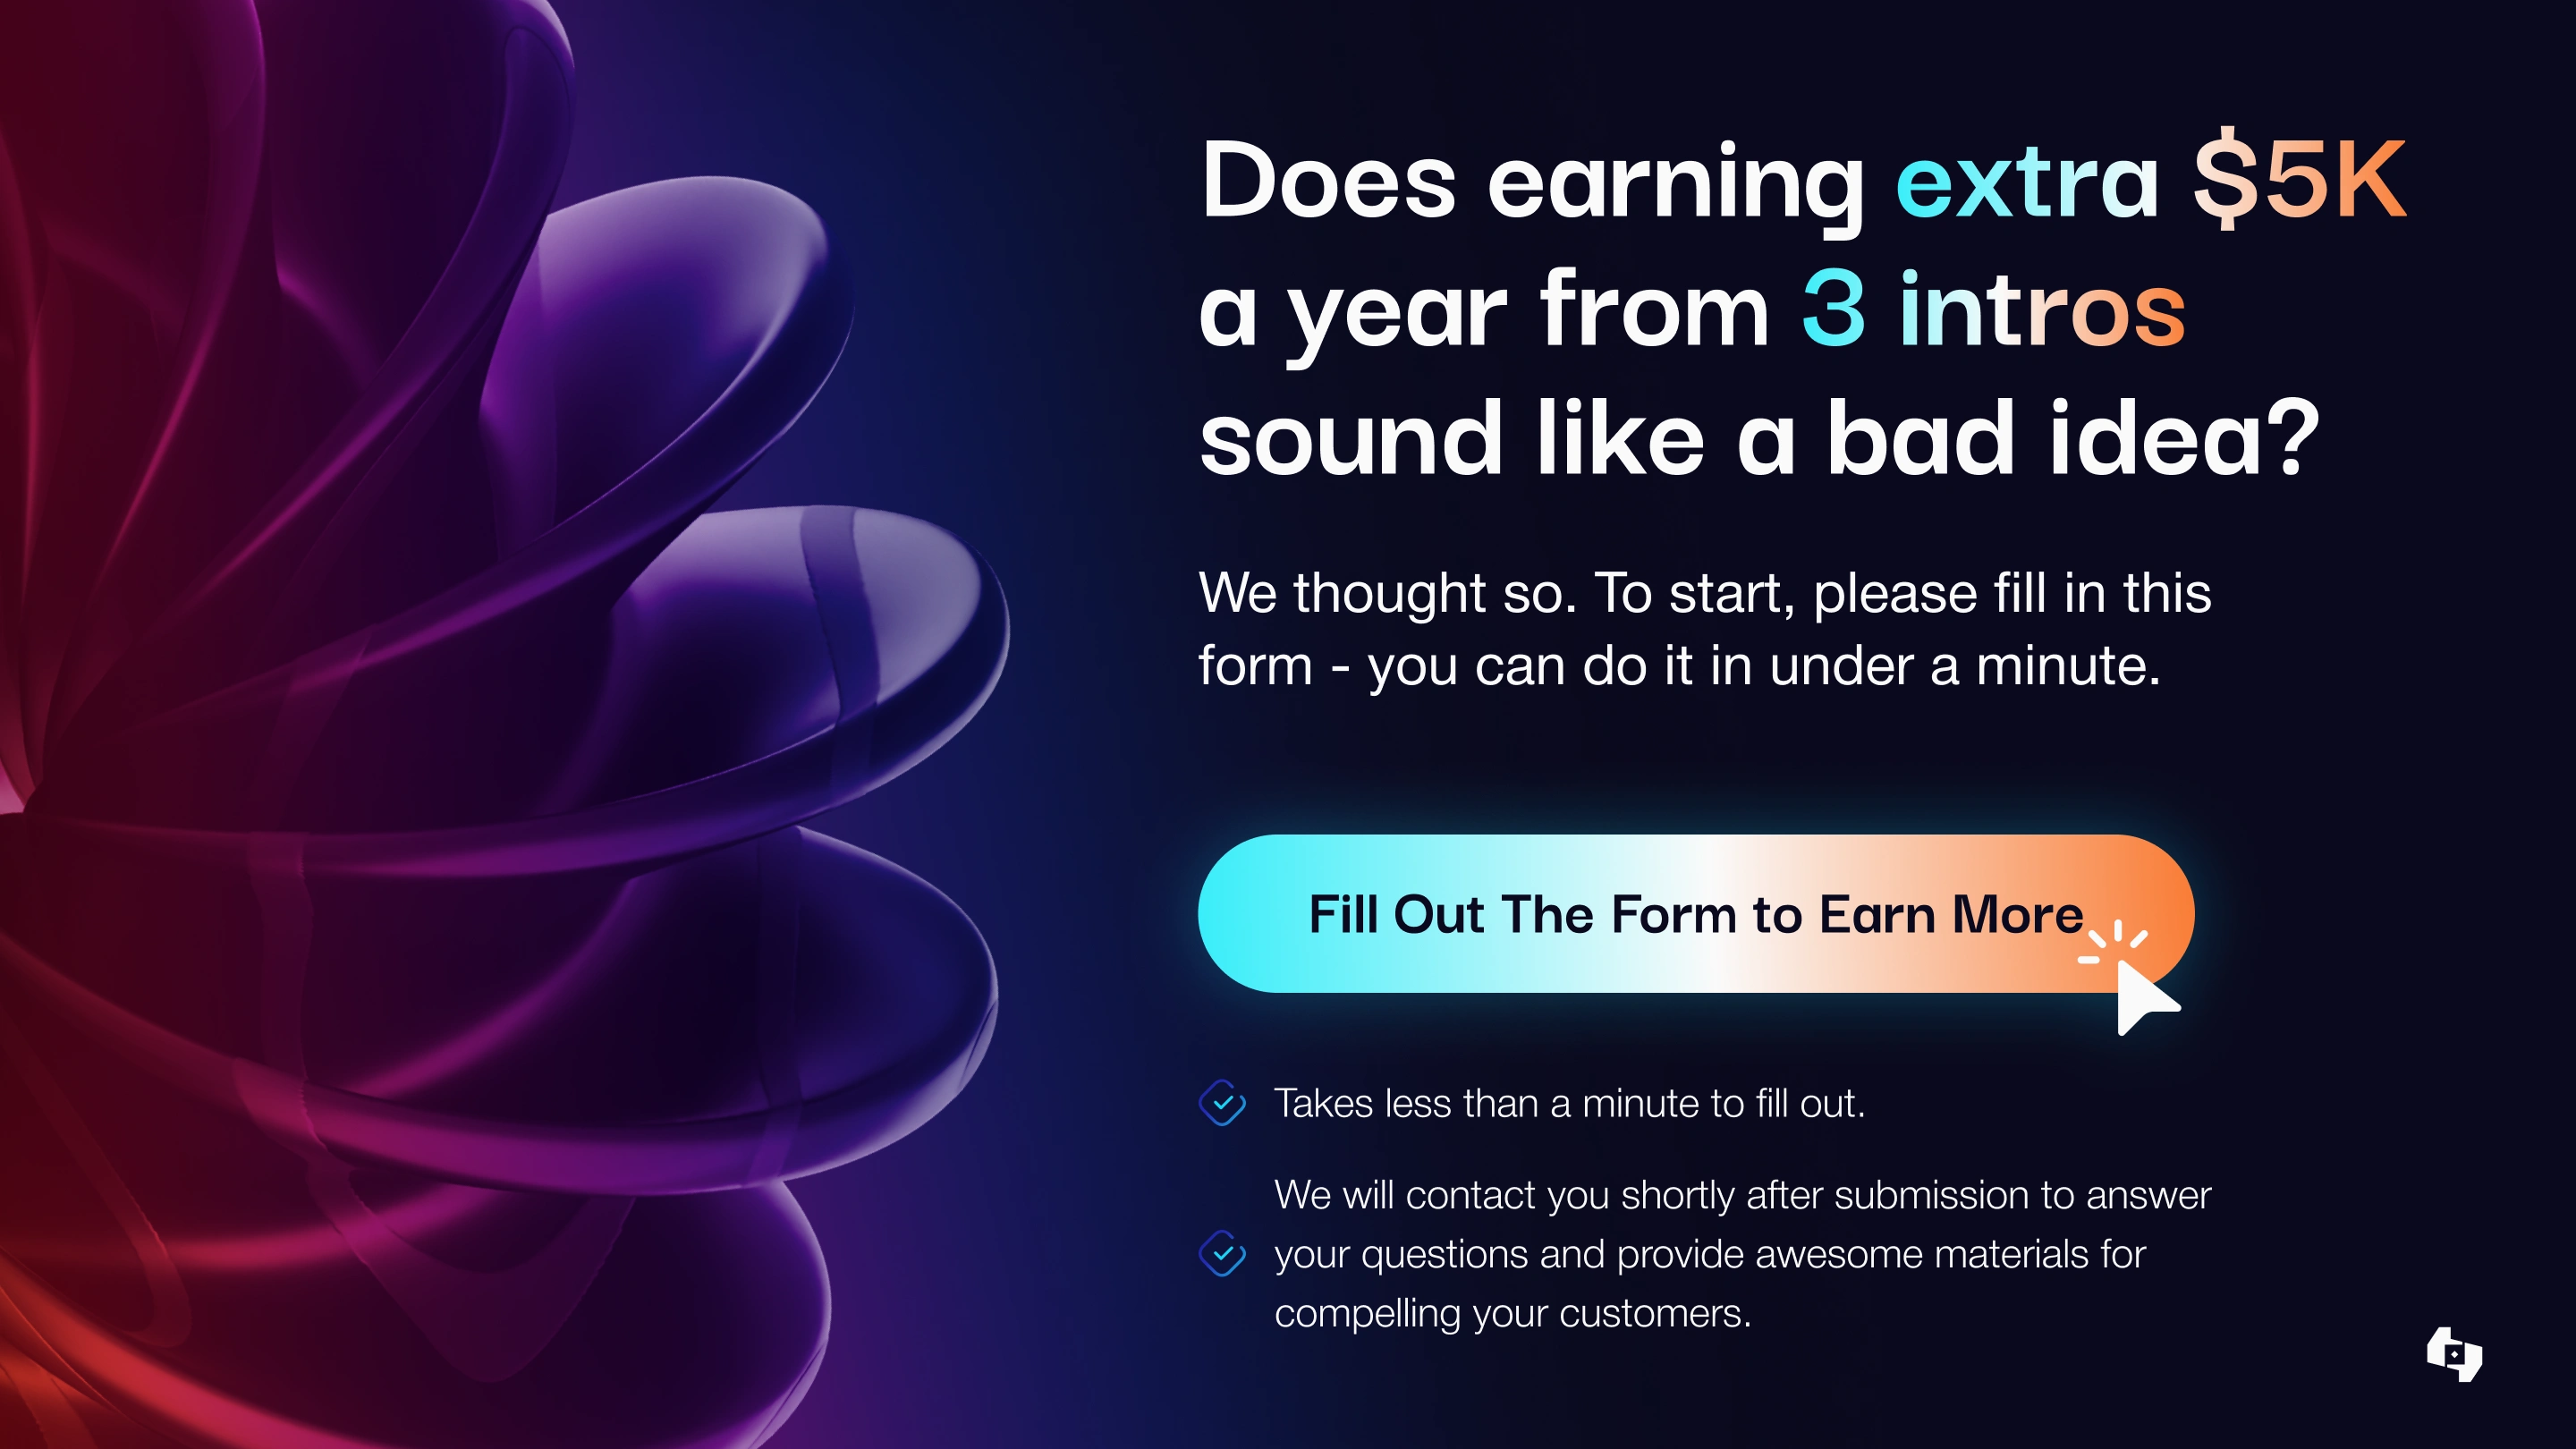
The presentation uses visual contrasts to guide attention: large earning figures, colour-coded blocks for different tiers, and step-by-step process iconography. The calculation table clearly shows income progression, and the colour-coded tiers are easy to distinguish. The final CTA becomes a logical conclusion after all visuals are presented.

Have a B2B product that needs visual clarity? Let's work together 🤝
Like this project
Posted Dec 3, 2025
Partner program presentation for a web3 marketing agency. Designed visual hierarchy and earning calculations to convert affiliates.